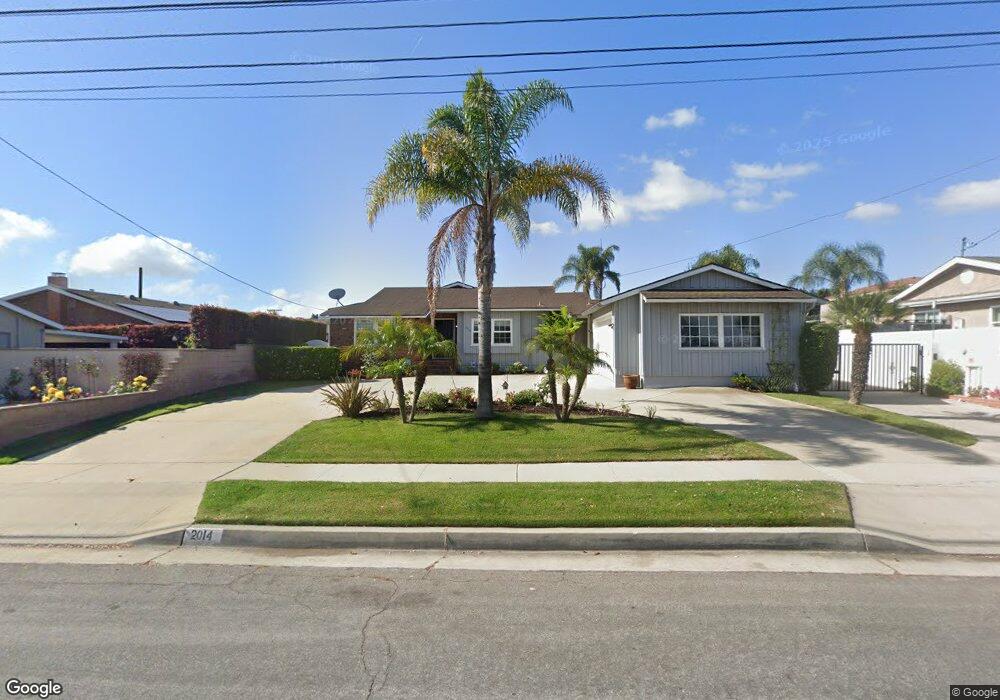
2014 W 237th St Torrance, CA 90501
Estimated Value: $1,108,000 - $1,250,409
3
Beds
2
Baths
2,029
Sq Ft
$587/Sq Ft
Est. Value
About This Home
This home is located at 2014 W 237th St, Torrance, CA 90501 and is currently estimated at $1,190,352, approximately $586 per square foot. 2014 W 237th St is a home located in Los Angeles County with nearby schools including John Adams Elementary School, J. H. Hull Middle School, and Torrance High School.
Ownership History
Date
Name
Owned For
Owner Type
Purchase Details
Closed on
Jan 26, 2011
Sold by
Fazis Gerald A and Fazis Nicolle Marie
Bought by
Fazis Gerald A and Fazis Nicolle Marie
Current Estimated Value
Home Financials for this Owner
Home Financials are based on the most recent Mortgage that was taken out on this home.
Original Mortgage
$230,000
Interest Rate
4.84%
Mortgage Type
New Conventional
Purchase Details
Closed on
Sep 20, 2004
Sold by
Fazis Gerald A
Bought by
Fazis Gerald A
Purchase Details
Closed on
Apr 16, 2004
Sold by
Fazis Gerald A and Dispenza Nicolle
Bought by
Fazis Gerald A
Home Financials for this Owner
Home Financials are based on the most recent Mortgage that was taken out on this home.
Original Mortgage
$320,000
Interest Rate
5.38%
Mortgage Type
New Conventional
Create a Home Valuation Report for This Property
The Home Valuation Report is an in-depth analysis detailing your home's value as well as a comparison with similar homes in the area
Home Values in the Area
Average Home Value in this Area
Purchase History
| Date | Buyer | Sale Price | Title Company |
|---|---|---|---|
| Fazis Gerald A | -- | First American Els | |
| Fazis Gerald A | -- | -- | |
| Fazis Gerald A | -- | -- | |
| Fazis Artur | -- | -- | |
| Fazis Gerald A | -- | Lawyers Title | |
| Fazis Gerald A | -- | Lawyers Title |
Source: Public Records
Mortgage History
| Date | Status | Borrower | Loan Amount |
|---|---|---|---|
| Closed | Fazis Gerald A | $230,000 | |
| Closed | Fazis Gerald A | $320,000 |
Source: Public Records
Tax History
| Year | Tax Paid | Tax Assessment Tax Assessment Total Assessment is a certain percentage of the fair market value that is determined by local assessors to be the total taxable value of land and additions on the property. | Land | Improvement |
|---|---|---|---|---|
| 2025 | $3,694 | $298,434 | $125,915 | $172,519 |
| 2024 | $3,694 | $292,584 | $123,447 | $169,137 |
| 2023 | $3,632 | $286,848 | $121,027 | $165,821 |
| 2022 | $3,583 | $281,224 | $118,654 | $162,570 |
| 2021 | $3,508 | $275,711 | $116,328 | $159,383 |
| 2019 | $3,410 | $267,535 | $112,879 | $154,656 |
| 2018 | $3,210 | $262,290 | $110,666 | $151,624 |
| 2016 | $3,049 | $252,107 | $106,370 | $145,737 |
| 2015 | $2,984 | $248,321 | $104,773 | $143,548 |
| 2014 | $2,916 | $243,458 | $102,721 | $140,737 |
Source: Public Records
Map
Nearby Homes
- 2128 W 238th St
- 2126 W 238th St
- 2124 W 238th St
- 2130 W 238th St
- 2147 W 236th St
- 24200 Walnut St Unit 34
- 23714 Alliene Ave
- 23805 Arlington Ave
- 23701 S Western Ave Unit 201
- 23701 S Western Ave Unit 197
- 23701 S Western Ave Unit 152
- 23701 S Western Ave Unit 72
- 23701 S Western Ave Unit 121
- 23701 S Western Ave Unit 106
- 23701 S Western Ave Unit 221
- 23701 S Western Ave Unit 259
- 23701 S Western Ave Unit 78A
- 23602 S Western Ave Unit D
- 1956 W 231st St
- 2279 W 239th St
- 2026 W 237th St
- 2006 W 237th St
- 23709 Cabrillo Ave
- 2016 W 237th St
- 23715 Cabrillo Ave
- 2024 W 237th St
- 2030 W 237th St
- 2025 W 237th St
- 2021 W 237th St
- 23719 Cabrillo Ave
- 2009 W 237th St
- 2032 W 237th St
- 2015 W 237th St
- 2005 W 237th St
- 2022 W 237th St
- 23725 Cabrillo Ave
- 2031 W 237th St
- 2036 W 237th St
- 2034 W 237th St
- 23633 Cabrillo Ave
Your Personal Tour Guide
Ask me questions while you tour the home.