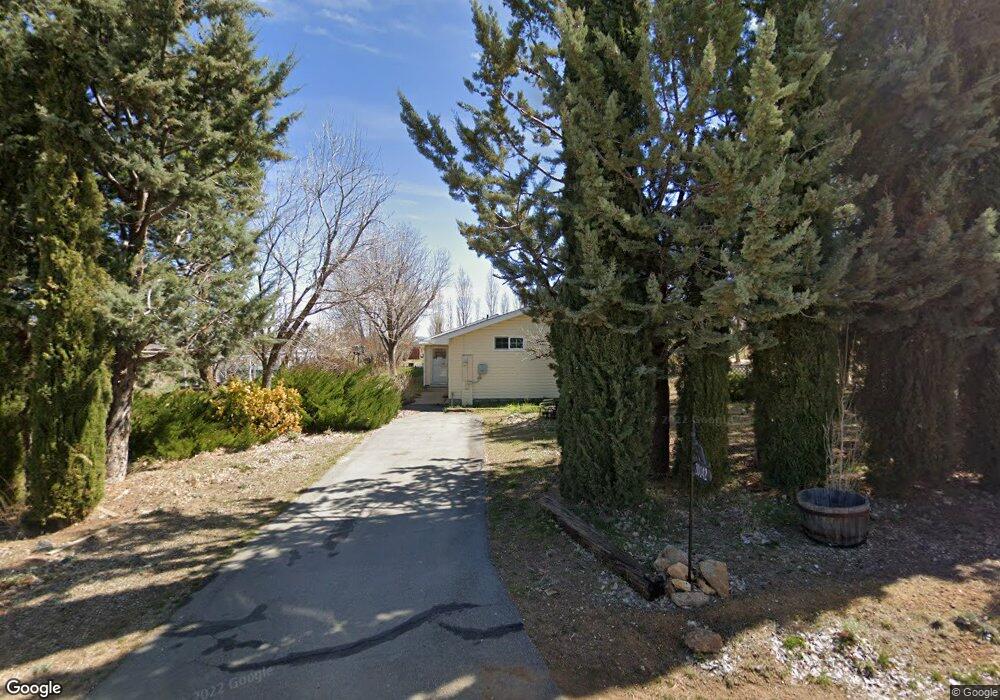
20142 Hayfield Ln Tehachapi, CA 93561
Estimated Value: $477,000 - $578,000
3
Beds
4
Baths
1,500
Sq Ft
$361/Sq Ft
Est. Value
About This Home
This home is located at 20142 Hayfield Ln, Tehachapi, CA 93561 and is currently estimated at $542,018, approximately $361 per square foot. 20142 Hayfield Ln is a home located in Kern County with nearby schools including Tompkins Elementary School, Jacobsen Middle School, and Tehachapi High School.
Ownership History
Date
Name
Owned For
Owner Type
Purchase Details
Closed on
Jul 17, 2019
Sold by
Dunwoody Kent and Dunwoody Colleen
Bought by
Dunwoody Kent and Dunwoody Colleen
Current Estimated Value
Purchase Details
Closed on
Dec 3, 1997
Sold by
Housing & Development Consultants Inc
Bought by
Stevenson Samuel M and Stevenson Jennie A
Home Financials for this Owner
Home Financials are based on the most recent Mortgage that was taken out on this home.
Original Mortgage
$143,310
Interest Rate
7.14%
Purchase Details
Closed on
Oct 21, 1997
Sold by
Stevevson Samuel M & Jennie A Tr
Bought by
Dunwoody Kent and Dunwoody Colleen
Home Financials for this Owner
Home Financials are based on the most recent Mortgage that was taken out on this home.
Original Mortgage
$143,310
Interest Rate
7.14%
Purchase Details
Closed on
Oct 14, 1994
Sold by
Stevenson Samuel M and Stevenson Jennie A
Bought by
Stevenson Samuel M and Stevenson Jennie A
Create a Home Valuation Report for This Property
The Home Valuation Report is an in-depth analysis detailing your home's value as well as a comparison with similar homes in the area
Home Values in the Area
Average Home Value in this Area
Purchase History
| Date | Buyer | Sale Price | Title Company |
|---|---|---|---|
| Dunwoody Kent | -- | None Available | |
| Stevenson Samuel M | $104,000 | Chicago Title Co | |
| Dunwoody Kent | $140,500 | Chicago Title Co | |
| Stevenson Samuel M | -- | -- |
Source: Public Records
Mortgage History
| Date | Status | Borrower | Loan Amount |
|---|---|---|---|
| Previous Owner | Dunwoody Kent | $143,310 |
Source: Public Records
Tax History
| Year | Tax Paid | Tax Assessment Tax Assessment Total Assessment is a certain percentage of the fair market value that is determined by local assessors to be the total taxable value of land and additions on the property. | Land | Improvement |
|---|---|---|---|---|
| 2025 | $2,654 | $224,316 | $63,853 | $160,463 |
| 2024 | $2,557 | $219,918 | $62,601 | $157,317 |
| 2023 | $2,557 | $215,607 | $61,374 | $154,233 |
| 2022 | $2,528 | $211,380 | $60,171 | $151,209 |
| 2021 | $2,488 | $207,237 | $58,992 | $148,245 |
| 2020 | $2,491 | $205,113 | $58,388 | $146,725 |
| 2019 | $2,489 | $205,113 | $58,388 | $146,725 |
| 2018 | $2,400 | $197,151 | $56,122 | $141,029 |
| 2017 | $2,395 | $193,286 | $55,022 | $138,264 |
| 2016 | $2,330 | $189,497 | $53,944 | $135,553 |
| 2015 | $2,217 | $186,651 | $53,134 | $133,517 |
| 2014 | $2,191 | $182,996 | $52,094 | $130,902 |
Source: Public Records
Map
Nearby Homes
- 20901 Oak Glen Ave
- 19777 Country Oaks St
- 0 Na Unit 25580293
- 0 Curinga Dr Unit 202501293
- 0 Stallion Springs Dr Unit 9993528
- 0 Na Unit 25499983
- 0 Vl 377-170-39 Unit 26000082
- 0 State Highway 202 Unit 202501933
- 0 State Highway 202 Unit 202501929
- 1 Valley Blvd
- 0 Water Canyon Rd
- 0 Vl 378-220-29 Unit 25007519
- 19655 Descanso St
- 20401 Brian Way
- 0 Oak Pass Unit SR25139678
- 0 Oak Pass Unit SR25139662
- 21192 Old Town Rd
- 21191 Santa Barbara Dr
- 0 Abajo Ave
- 21221 Santa Barbara Dr
- 20139 Hayfield Ln
- 20086 Hayfield Ln
- 20781 Highline Rd
- 20200 Neely Ave
- 20709 Highline Rd
- 20830 Neely Ave
- 20854 Apple Tree Ln
- 20733 Neely Ave
- 20809 Neely Ave
- 20825 Highline Rd
- 20669 Neely Ave
- 20607 Neely Ave
- 20561 Highline Rd
- 0 Neely Ave
- 20853 Neely Ave
- 20701 Oak Glen Ct
- 20645 Neely Ave
- 20145 Woodford Tehachapi Rd
- 20879 Highline Rd
- 20827 Neely Ave
Your Personal Tour Guide
Ask me questions while you tour the home.