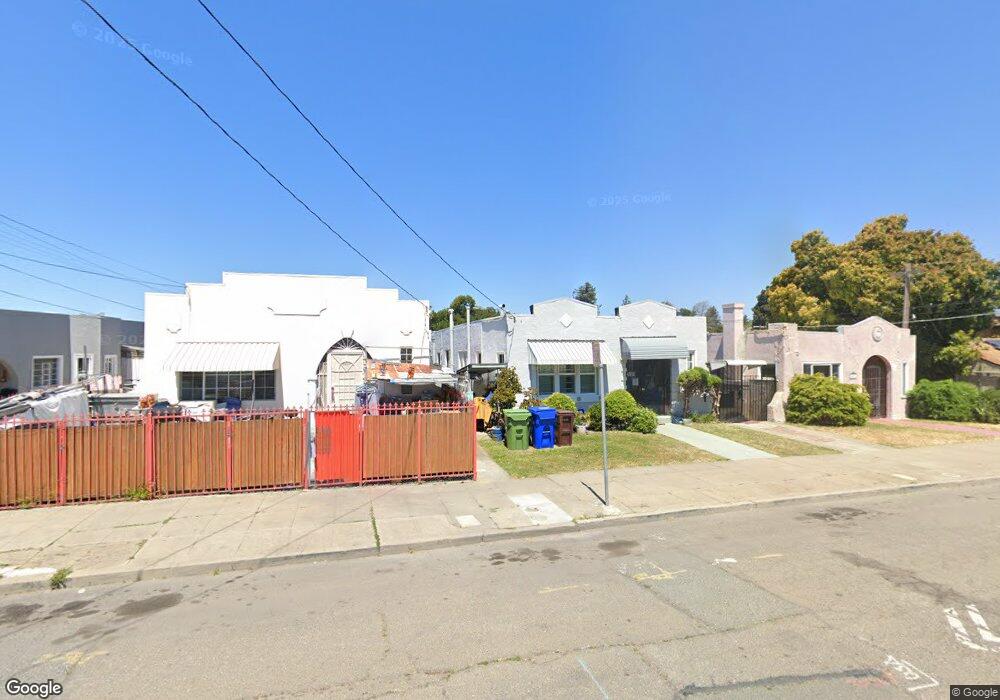
2015 16th Ave Oakland, CA 94606
San Antonio NeighborhoodEstimated Value: $571,000 - $644,529
4
Beds
1
Bath
1,486
Sq Ft
$408/Sq Ft
Est. Value
About This Home
This home is located at 2015 16th Ave, Oakland, CA 94606 and is currently estimated at $606,632, approximately $408 per square foot. 2015 16th Ave is a home located in Alameda County with nearby schools including Garfield Elementary School, Roosevelt Middle School, and Oakland High School.
Ownership History
Date
Name
Owned For
Owner Type
Purchase Details
Closed on
Jul 21, 1995
Sold by
Jung Leung Lai Ha
Bought by
Wong Sze Wang
Current Estimated Value
Home Financials for this Owner
Home Financials are based on the most recent Mortgage that was taken out on this home.
Original Mortgage
$72,800
Interest Rate
7.62%
Purchase Details
Closed on
Feb 8, 1994
Sold by
Jung Leung Lai Ha and Jung Rose Wai Won
Bought by
Jung Leung Lai Ha
Create a Home Valuation Report for This Property
The Home Valuation Report is an in-depth analysis detailing your home's value as well as a comparison with similar homes in the area
Home Values in the Area
Average Home Value in this Area
Purchase History
| Date | Buyer | Sale Price | Title Company |
|---|---|---|---|
| Wong Sze Wang | $113,000 | Fidelity National Title Ins | |
| Jung Leung Lai Ha | -- | -- |
Source: Public Records
Mortgage History
| Date | Status | Borrower | Loan Amount |
|---|---|---|---|
| Closed | Wong Sze Wang | $72,800 |
Source: Public Records
Tax History Compared to Growth
Tax History
| Year | Tax Paid | Tax Assessment Tax Assessment Total Assessment is a certain percentage of the fair market value that is determined by local assessors to be the total taxable value of land and additions on the property. | Land | Improvement |
|---|---|---|---|---|
| 2025 | $4,818 | $240,342 | $56,313 | $184,029 |
| 2024 | $4,818 | $235,630 | $55,209 | $180,421 |
| 2023 | $4,968 | $231,009 | $54,126 | $176,883 |
| 2022 | $4,786 | $226,481 | $53,065 | $173,416 |
| 2021 | $4,467 | $222,041 | $52,025 | $170,016 |
| 2020 | $4,417 | $219,765 | $51,492 | $168,273 |
| 2019 | $4,182 | $215,456 | $50,482 | $164,974 |
| 2018 | $4,099 | $211,233 | $49,492 | $161,741 |
| 2017 | $3,917 | $207,092 | $48,522 | $158,570 |
| 2016 | $3,723 | $203,033 | $47,571 | $155,462 |
| 2015 | $3,701 | $199,985 | $46,857 | $153,128 |
| 2014 | $3,664 | $196,068 | $45,939 | $150,129 |
Source: Public Records
Map
Nearby Homes