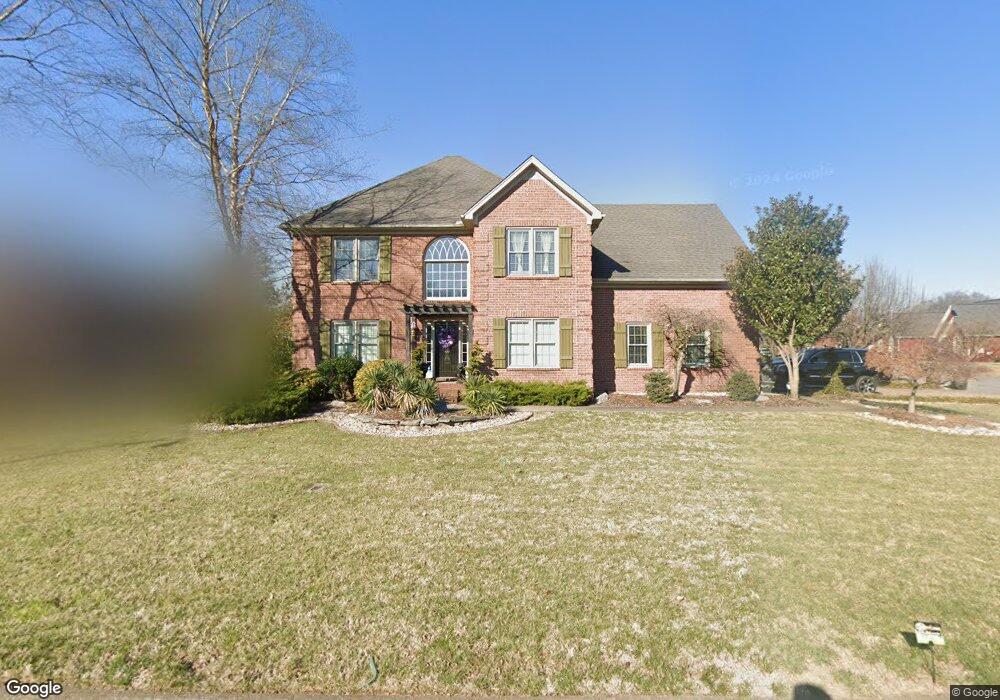
2015 Abrams Ct Murfreesboro, TN 37130
Estimated Value: $532,072 - $703,000
Studio
3
Baths
2,598
Sq Ft
$236/Sq Ft
Est. Value
About This Home
This home is located at 2015 Abrams Ct, Murfreesboro, TN 37130 and is currently estimated at $612,268, approximately $235 per square foot. 2015 Abrams Ct is a home located in Rutherford County with nearby schools including Reeves-Rogers Elementary School, Oakland Middle School, and Oakland High School.
Ownership History
Date
Name
Owned For
Owner Type
Purchase Details
Closed on
Dec 22, 2023
Sold by
Ryder Steve and Ryder Sherry
Bought by
Ryder Family Trust and Ryder
Current Estimated Value
Purchase Details
Closed on
Mar 2, 2006
Sold by
Jacqueline Carter
Bought by
Ryder and Sherry
Home Financials for this Owner
Home Financials are based on the most recent Mortgage that was taken out on this home.
Original Mortgage
$146,000
Interest Rate
6.19%
Mortgage Type
Purchase Money Mortgage
Purchase Details
Closed on
Jan 19, 2000
Bought by
Jacqueline Carter
Purchase Details
Closed on
Nov 12, 1996
Sold by
J & J Venture
Bought by
Panter Brenda K
Home Financials for this Owner
Home Financials are based on the most recent Mortgage that was taken out on this home.
Original Mortgage
$138,200
Interest Rate
7.83%
Purchase Details
Closed on
Mar 25, 1996
Sold by
Garrison Cove Venture
Bought by
J & J Venture
Create a Home Valuation Report for This Property
The Home Valuation Report is an in-depth analysis detailing your home's value as well as a comparison with similar homes in the area
Home Values in the Area
Average Home Value in this Area
Purchase History
| Date | Buyer | Sale Price | Title Company |
|---|---|---|---|
| Ryder Family Trust | -- | None Listed On Document | |
| Ryder | $241,000 | -- | |
| Jacqueline Carter | $206,000 | -- | |
| Panter Brenda K | $172,800 | -- | |
| J & J Venture | $27,900 | -- |
Source: Public Records
Mortgage History
| Date | Status | Borrower | Loan Amount |
|---|---|---|---|
| Previous Owner | J & J Venture | $146,000 | |
| Previous Owner | J & J Venture | $138,200 |
Source: Public Records
Tax History
| Year | Tax Paid | Tax Assessment Tax Assessment Total Assessment is a certain percentage of the fair market value that is determined by local assessors to be the total taxable value of land and additions on the property. | Land | Improvement |
|---|---|---|---|---|
| 2025 | $2,890 | $115,225 | $16,875 | $98,350 |
| 2024 | $3,260 | $115,225 | $16,875 | $98,350 |
| 2023 | $2,163 | $115,275 | $16,875 | $98,400 |
| 2022 | $1,863 | $115,275 | $16,875 | $98,400 |
| 2021 | $1,778 | $80,125 | $16,875 | $63,250 |
| 2020 | $1,778 | $80,125 | $16,875 | $63,250 |
| 2019 | $1,778 | $80,125 | $16,875 | $63,250 |
| 2018 | $2,443 | $80,125 | $0 | $0 |
| 2017 | $2,545 | $65,475 | $0 | $0 |
| 2016 | $2,545 | $65,475 | $0 | $0 |
| 2015 | $2,545 | $65,475 | $0 | $0 |
| 2014 | $1,628 | $65,475 | $0 | $0 |
| 2013 | -- | $64,450 | $0 | $0 |
Source: Public Records
Map
Nearby Homes
- 2006 Abrams Ct
- 2306 Garrison Cove
- 2092 Leamington Ln
- 2094 Leamington Ln
- 1912 Nightwalk Ct
- 2331 Lionheart Dr
- 2475 Oak Hill Dr
- 2522 Jackalope St
- 2236 Patriot Dr
- 1307 Amsterdam Ct
- 2164 White Poplar Ct
- 2160 White Poplar Ct
- 2310 Higgins Ln
- 2111 White Poplar Ct
- 2187 Gold Valley Dr
- 1518 Belle Oaks Dr
- 0 Pitts Ln
- 0 Dejarnette Ln Unit RTC3152425
- 788 Dejarnette Ln
- 1102 Falling Tree Ct
- 2011 Abrams Ct
- 2214 Garrison Cove
- 2219 Garrison Cove
- 2014 Look Rock Ct
- 2014 Abrams Ct
- 2007 Abrams Ct
- 2223 Garrison Cove
- 2010 Look Rock Ct
- 2010 Abrams Ct
- 2215 Garrison Cove
- 2003 Abrams Ct
- 2019 Creekwalk Dr
- 2227 Garrison Cove
- 2006 Look Rock Ct
- 2106 Look Rock Ct
- 2015 Creekwalk Dr
- 2002 Abrams Ct
- 2107 Creekwalk Dr
- 2210 Garrison Cove
- 2013 Look Rock Ct
Your Personal Tour Guide
Ask me questions while you tour the home.