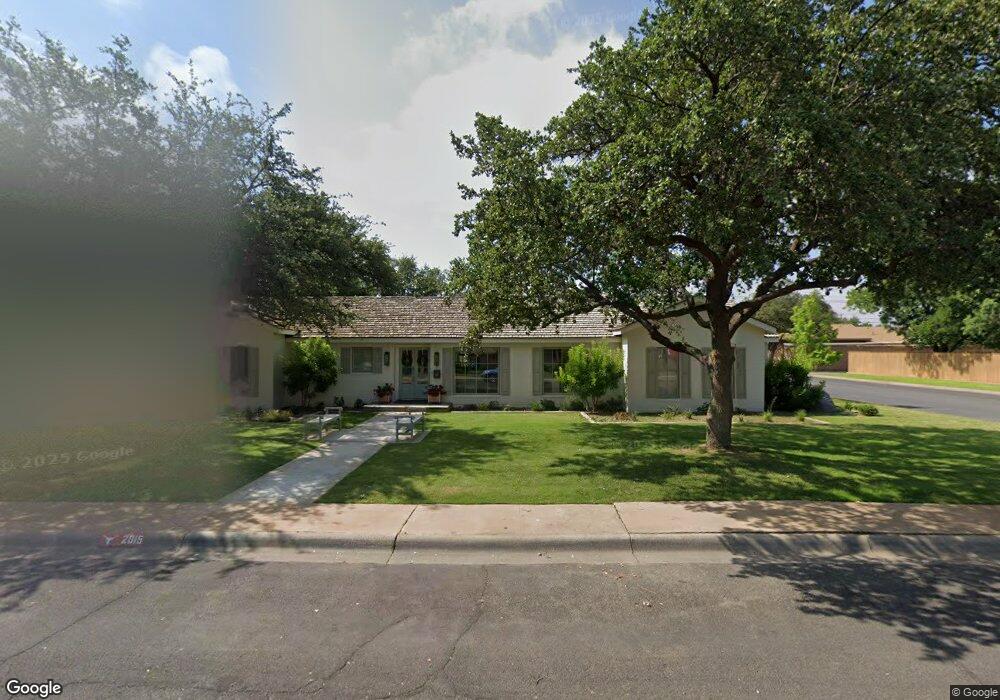
2015 Boyd Ave Midland, TX 79705
Estimated Value: $686,000 - $1,343,000
Studio
2
Baths
3,778
Sq Ft
$290/Sq Ft
Est. Value
About This Home
This home is located at 2015 Boyd Ave, Midland, TX 79705 and is currently estimated at $1,095,099, approximately $289 per square foot. 2015 Boyd Ave is a home located in Midland County with nearby schools including Fannin Elementary School, San Jacinto Junior High School, and Midland High School.
Ownership History
Date
Name
Owned For
Owner Type
Purchase Details
Closed on
Feb 1, 2022
Sold by
Jake Feldt
Bought by
Shannon Robert and Shannon Samantha S
Current Estimated Value
Home Financials for this Owner
Home Financials are based on the most recent Mortgage that was taken out on this home.
Original Mortgage
$500,000
Outstanding Balance
$454,586
Interest Rate
2.13%
Mortgage Type
New Conventional
Estimated Equity
$640,513
Purchase Details
Closed on
May 24, 2018
Sold by
Morris John W and Morris Kaci A
Bought by
Feldt Jake and Feldt Ashley
Purchase Details
Closed on
May 23, 2017
Sold by
Schoch Frederick D and Schoch Rececca H
Bought by
Morris John W and Morris Kaci A
Home Financials for this Owner
Home Financials are based on the most recent Mortgage that was taken out on this home.
Original Mortgage
$203,750
Interest Rate
4.08%
Mortgage Type
New Conventional
Purchase Details
Closed on
Dec 4, 1979
Bought by
Morris John W
Create a Home Valuation Report for This Property
The Home Valuation Report is an in-depth analysis detailing your home's value as well as a comparison with similar homes in the area
Purchase History
| Date | Buyer | Sale Price | Title Company |
|---|---|---|---|
| Shannon Robert | -- | New Title Company Name | |
| Feldt Jake | -- | West Texas Abstract & Title | |
| Morris John W | -- | None Available | |
| Morris John W | -- | -- |
Source: Public Records
Mortgage History
| Date | Status | Borrower | Loan Amount |
|---|---|---|---|
| Open | Shannon Robert | $500,000 | |
| Previous Owner | Morris John W | $203,750 | |
| Closed | Feldt Jake | $0 |
Source: Public Records
Tax History
| Year | Tax Paid | Tax Assessment Tax Assessment Total Assessment is a certain percentage of the fair market value that is determined by local assessors to be the total taxable value of land and additions on the property. | Land | Improvement |
|---|---|---|---|---|
| 2025 | $18,378 | $1,210,270 | $26,670 | $1,183,600 |
| 2024 | $16,570 | $1,222,730 | $26,670 | $1,196,060 |
| 2023 | $16,226 | $1,215,300 | $26,670 | $1,188,630 |
| 2022 | $8,211 | $525,510 | $26,670 | $498,840 |
| 2021 | $9,253 | $531,130 | $26,670 | $504,460 |
| 2019 | $9,531 | $503,430 | $26,670 | $476,760 |
| 2018 | $4,115 | $211,620 | $26,670 | $184,950 |
| 2017 | $3,275 | $168,460 | $26,670 | $141,790 |
| 2016 | $3,251 | $166,910 | $26,670 | $140,240 |
| 2015 | -- | $166,910 | $26,670 | $140,240 |
| 2014 | -- | $160,710 | $26,670 | $134,040 |
Source: Public Records
Map
Nearby Homes
- 2207 Boyd Ave
- 1604 N N St
- 1605 Mcclintic St
- 6716 S County Road 1160 Unit A
- 1608 N L St
- 2001 Winfield Rd
- 2011 Community Ln
- 1901 N Garfield St
- 1608 Shell Ave
- 1607 Shell Ave
- 1606 Shell Ave
- 1605 Shell Ave
- 2303 Shell Ave
- 2208 Princeton Ave
- 1602 Winfield Rd
- 1422 Lanham St
- 2500 Concord Ave
- 1601 Stanolind Ave
- 2208 Bedford Dr
- 2009 Bedford Dr
- 2007 Boyd Ave
- 2014 W Golf Course Rd
- 2201 Boyd Ave
- 2008 W Golf Course Rd
- 2005 Boyd Ave
- 2014 Boyd Ave
- 2002 Boyd Ave
- 2200 W Golf Course Rd
- 2006 W Golf Course Rd
- 2200 Boyd Ave
- 2203 Boyd Ave
- 2003 Boyd Ave
- 2202 W Golf Course Rd
- 2202 Boyd Ave
- 2004 W Golf Course Rd
- 2005 Sinclair Ave
- 2015 Sinclair Ave
- 2003 Sinclair Ave
- 1610 N N St
- 2205 Boyd Ave
Your Personal Tour Guide
Ask me questions while you tour the home.