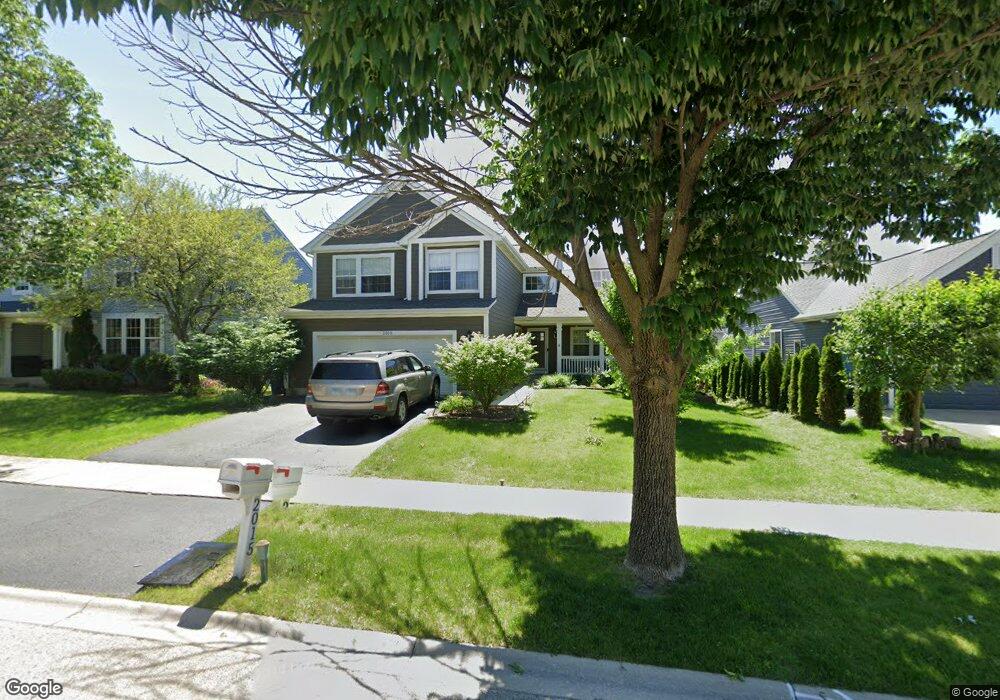
2015 Chesterfield Ln Aurora, IL 60503
Far Southeast NeighborhoodEstimated Value: $472,000 - $500,000
4
Beds
4
Baths
2,382
Sq Ft
$205/Sq Ft
Est. Value
About This Home
This home is located at 2015 Chesterfield Ln, Aurora, IL 60503 and is currently estimated at $488,200, approximately $204 per square foot. 2015 Chesterfield Ln is a home located in Kendall County with nearby schools including The Wheatlands Elementary School, Bednarcik Jr. High School, and Oswego East High School.
Ownership History
Date
Name
Owned For
Owner Type
Purchase Details
Closed on
May 9, 2008
Sold by
Mortgage Guaranty Insurance Corp
Bought by
Adebiyi Shakira and Adebiyi Adewale
Current Estimated Value
Home Financials for this Owner
Home Financials are based on the most recent Mortgage that was taken out on this home.
Original Mortgage
$263,859
Outstanding Balance
$167,537
Interest Rate
5.93%
Mortgage Type
FHA
Estimated Equity
$320,663
Purchase Details
Closed on
Dec 18, 2007
Sold by
Federal National Mortgage Association
Bought by
Mortgage Guaranty Insurance Corp
Purchase Details
Closed on
Oct 16, 2007
Sold by
Adams Stephen M and Adams Christine M
Bought by
Federal National Mortgage Association
Purchase Details
Closed on
Jun 14, 1999
Sold by
The Northern Trust Company
Bought by
Adams Stephen M and Adams Christine M
Home Financials for this Owner
Home Financials are based on the most recent Mortgage that was taken out on this home.
Original Mortgage
$218,900
Interest Rate
7.68%
Create a Home Valuation Report for This Property
The Home Valuation Report is an in-depth analysis detailing your home's value as well as a comparison with similar homes in the area
Home Values in the Area
Average Home Value in this Area
Purchase History
| Date | Buyer | Sale Price | Title Company |
|---|---|---|---|
| Adebiyi Shakira | $268,000 | Atg | |
| Mortgage Guaranty Insurance Corp | -- | None Available | |
| Federal National Mortgage Association | -- | None Available | |
| Adams Stephen M | $260,000 | Chicago Title Insurance Co |
Source: Public Records
Mortgage History
| Date | Status | Borrower | Loan Amount |
|---|---|---|---|
| Open | Adebiyi Shakira | $263,859 | |
| Previous Owner | Adams Stephen M | $218,900 |
Source: Public Records
Tax History Compared to Growth
Tax History
| Year | Tax Paid | Tax Assessment Tax Assessment Total Assessment is a certain percentage of the fair market value that is determined by local assessors to be the total taxable value of land and additions on the property. | Land | Improvement |
|---|---|---|---|---|
| 2024 | $11,487 | $135,292 | $28,223 | $107,069 |
| 2023 | $10,553 | $120,796 | $25,199 | $95,597 |
| 2022 | $10,553 | $110,822 | $23,118 | $87,704 |
| 2021 | $9,906 | $100,747 | $21,016 | $79,731 |
| 2020 | $9,816 | $98,772 | $20,604 | $78,168 |
| 2019 | $9,839 | $96,866 | $20,604 | $76,262 |
| 2018 | $9,441 | $93,518 | $19,892 | $73,626 |
| 2017 | $9,154 | $86,192 | $18,334 | $67,858 |
| 2016 | $8,774 | $81,698 | $17,378 | $64,320 |
| 2015 | $9,043 | $77,807 | $16,550 | $61,257 |
| 2014 | -- | $73,403 | $15,613 | $57,790 |
| 2013 | -- | $74,145 | $15,771 | $58,374 |
Source: Public Records
Map
Nearby Homes
- 2060 Lyndhurst Ln
- 1611 Fredericksburg Ln Unit 1
- 2216 Summerlin Dr Unit 5
- 1739 Baler Ave
- 1745 Baler Ave
- 2084 Canyon Creek Ct
- 1751 Baler Ave
- 1757 Baler Ave
- 1776 Stable Ln
- 1764 Stable Ln
- 1870 Canyon Creek Dr
- 1830 Canyon Creek Dr
- 1880 Canyon Creek Dr
- Bellamy Plan at Wheatland Crossing
- Henley Plan at Wheatland Crossing
- Ashton Plan at Wheatland Crossing
- Coventry Plan at Wheatland Crossing
- 2047 James Leigh Dr
- 1855 Keating Dr
- 1794 Fredericksburg Ln
- 2007 Chesterfield Ln
- 2023 Chesterfield Ln
- 2036 Dunhill Ln
- 2028 Dunhill Ln
- 1999 Chesterfield Ln
- 2031 Chesterfield Ln
- 2044 Dunhill Ln
- 2020 Dunhill Ln
- 2018 Chesterfield Ln Unit 3
- 2010 Chesterfield Ln Unit 3
- 2052 Dunhill Ln
- 2026 Chesterfield Ln
- 1991 Chesterfield Ln
- 2039 Chesterfield Ln
- 2002 Chesterfield Ln
- 2012 Dunhill Ln
- 2034 Chesterfield Ln
- 1994 Chesterfield Ln
- 2060 Dunhill Ln
- 1983 Chesterfield Ln