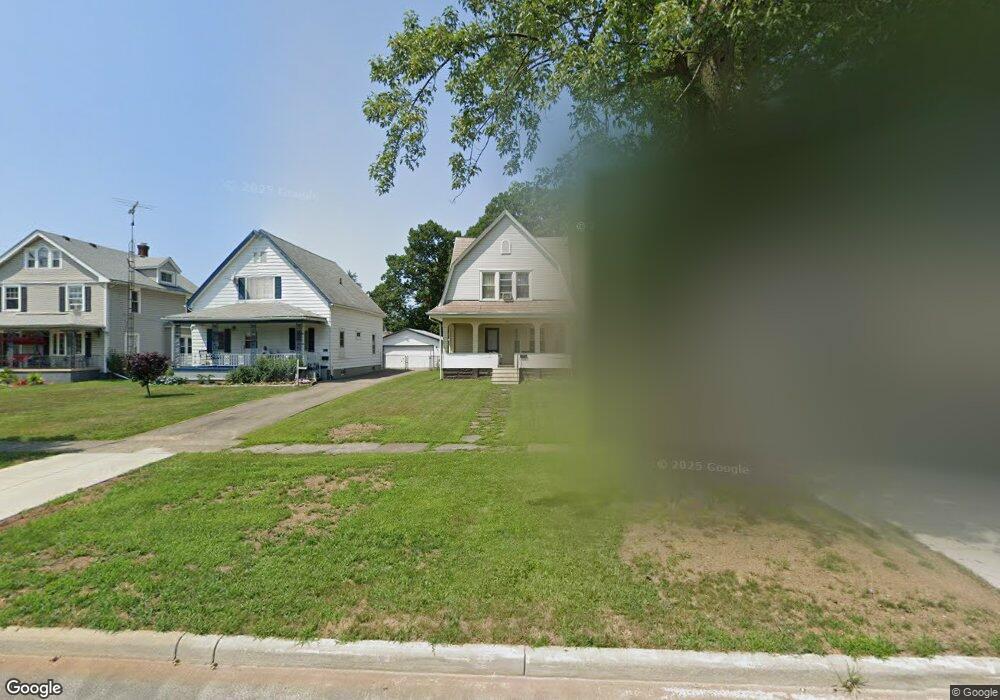
2015 E 31st St Lorain, OH 44055
Estimated Value: $122,000 - $175,000
3
Beds
1
Bath
2,273
Sq Ft
$63/Sq Ft
Est. Value
About This Home
This home is located at 2015 E 31st St, Lorain, OH 44055 and is currently estimated at $143,107, approximately $62 per square foot. 2015 E 31st St is a home located in Lorain County with nearby schools including Palm Elementary School, Southview Middle School, and Lorain High School.
Ownership History
Date
Name
Owned For
Owner Type
Purchase Details
Closed on
Nov 6, 2009
Sold by
Zollos Phillip D and Zollos Maureen
Bought by
Ariston Investments Llc
Current Estimated Value
Purchase Details
Closed on
Jun 24, 2008
Sold by
Wells Fargo Bank Minnesota Na
Bought by
Zollos Phil
Purchase Details
Closed on
Nov 8, 2007
Sold by
Wilkes Nandi
Bought by
Wells Fargo Bank Minnesota Na and Registered Holders Of The Merrill Lynch
Purchase Details
Closed on
Mar 21, 2002
Sold by
Mario Villa and Mario Tamera I
Bought by
Wilkes Nandi
Home Financials for this Owner
Home Financials are based on the most recent Mortgage that was taken out on this home.
Original Mortgage
$78,400
Interest Rate
6.95%
Purchase Details
Closed on
Feb 6, 1997
Sold by
Villa Salvado
Bought by
Villa Mario
Home Financials for this Owner
Home Financials are based on the most recent Mortgage that was taken out on this home.
Original Mortgage
$46,400
Interest Rate
7.73%
Mortgage Type
FHA
Create a Home Valuation Report for This Property
The Home Valuation Report is an in-depth analysis detailing your home's value as well as a comparison with similar homes in the area
Home Values in the Area
Average Home Value in this Area
Purchase History
| Date | Buyer | Sale Price | Title Company |
|---|---|---|---|
| Ariston Investments Llc | -- | Attorney | |
| Zollos Phil | $20,000 | Attorney | |
| Wells Fargo Bank Minnesota Na | $42,000 | Chicago Title | |
| Wilkes Nandi | $71,000 | Tri Source Title Agency Inc | |
| Villa Mario | $46,000 | -- |
Source: Public Records
Mortgage History
| Date | Status | Borrower | Loan Amount |
|---|---|---|---|
| Previous Owner | Wilkes Nandi | $78,400 | |
| Previous Owner | Villa Mario | $46,400 |
Source: Public Records
Tax History
| Year | Tax Paid | Tax Assessment Tax Assessment Total Assessment is a certain percentage of the fair market value that is determined by local assessors to be the total taxable value of land and additions on the property. | Land | Improvement |
|---|---|---|---|---|
| 2024 | $1,427 | $33,775 | $5,390 | $28,385 |
| 2023 | $1,207 | $22,841 | $3,283 | $19,558 |
| 2022 | $1,196 | $22,841 | $3,283 | $19,558 |
| 2021 | $1,196 | $22,841 | $3,283 | $19,558 |
| 2020 | $1,212 | $20,090 | $2,890 | $17,200 |
| 2019 | $1,205 | $20,090 | $2,890 | $17,200 |
| 2018 | $920 | $20,090 | $2,890 | $17,200 |
| 2017 | $635 | $9,980 | $3,850 | $6,130 |
| 2016 | $630 | $9,980 | $3,850 | $6,130 |
| 2015 | $595 | $9,980 | $3,850 | $6,130 |
| 2014 | $594 | $9,980 | $3,850 | $6,130 |
| 2013 | $589 | $9,980 | $3,850 | $6,130 |
Source: Public Records
Map
Nearby Homes
- 2066 E 30th St
- 2217 E 32nd St
- 1829 E 33rd St
- 1863 E 37th St
- 1809 E 34th St
- 1951 E 39th St
- 1794 E 33rd St
- 0 Pearl Ave Unit 5112836
- 1886 Homewood Dr
- 2119 E 41st St
- 2440 E 32nd St
- 2108 E 41st St
- 1711 E 30th St
- 1743 E 36th St
- 3934 Gary Ave
- V/L Clinton Ave
- 1685 E 36th St
- V/L Pearl Ave
- 3308 Norfolk Ave
- 3641 Tacoma Ave
Your Personal Tour Guide
Ask me questions while you tour the home.