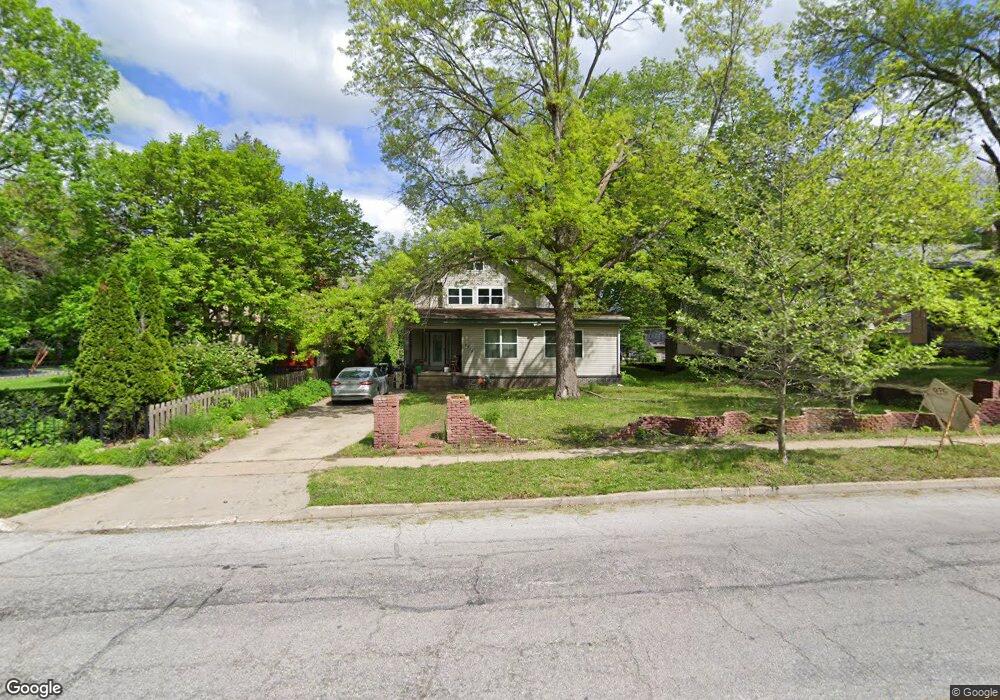
2015 E 9th St Des Moines, IA 50316
Union Park NeighborhoodEstimated Value: $312,000 - $351,177
7
Beds
4
Baths
4,877
Sq Ft
$67/Sq Ft
Est. Value
About This Home
This home is located at 2015 E 9th St, Des Moines, IA 50316 and is currently estimated at $328,544, approximately $67 per square foot. 2015 E 9th St is a home located in Polk County with nearby schools including Findley Elementary School, Harding Middle School, and North High School.
Ownership History
Date
Name
Owned For
Owner Type
Purchase Details
Closed on
Jul 27, 2023
Sold by
Perry Alayna B
Bought by
Leff Scott N and Leff Traci A
Current Estimated Value
Purchase Details
Closed on
Jan 31, 2022
Sold by
Strata Trust Company
Bought by
Leff Enterprises Llc
Purchase Details
Closed on
Jan 17, 2022
Sold by
Strata Trust Company
Bought by
Leff Enterprises Llc
Purchase Details
Closed on
Apr 2, 2009
Sold by
Leff Scott and Leff Traci
Bought by
Hoffman Scott
Home Financials for this Owner
Home Financials are based on the most recent Mortgage that was taken out on this home.
Original Mortgage
$128,600
Interest Rate
5.11%
Mortgage Type
Seller Take Back
Purchase Details
Closed on
Dec 14, 2005
Sold by
Erlich Angela and Erlich Claus
Bought by
Leff Scott N and Leff Traci A
Home Financials for this Owner
Home Financials are based on the most recent Mortgage that was taken out on this home.
Original Mortgage
$85,600
Interest Rate
6.36%
Mortgage Type
Fannie Mae Freddie Mac
Create a Home Valuation Report for This Property
The Home Valuation Report is an in-depth analysis detailing your home's value as well as a comparison with similar homes in the area
Home Values in the Area
Average Home Value in this Area
Purchase History
| Date | Buyer | Sale Price | Title Company |
|---|---|---|---|
| Leff Scott N | $145,000 | None Listed On Document | |
| Leff Scott N | $145,000 | None Listed On Document | |
| Leff Enterprises Llc | $16,000 | Hubbard Law Firm Pc | |
| Leff Enterprises Llc | $16,000 | Hubbard Law Firm Pc | |
| Hoffman Scott | $129,900 | None Available | |
| Leff Scott N | $106,500 | -- |
Source: Public Records
Mortgage History
| Date | Status | Borrower | Loan Amount |
|---|---|---|---|
| Previous Owner | Hoffman Scott | $128,600 | |
| Previous Owner | Leff Scott N | $85,600 |
Source: Public Records
Tax History
| Year | Tax Paid | Tax Assessment Tax Assessment Total Assessment is a certain percentage of the fair market value that is determined by local assessors to be the total taxable value of land and additions on the property. | Land | Improvement |
|---|---|---|---|---|
| 2025 | $6,038 | $352,500 | $39,200 | $313,300 |
| 2024 | $6,038 | $317,400 | $34,600 | $282,800 |
| 2023 | $6,196 | $317,400 | $34,600 | $282,800 |
| 2022 | $6,148 | $271,800 | $31,400 | $240,400 |
| 2021 | $5,830 | $271,800 | $31,400 | $240,400 |
| 2020 | $6,050 | $242,200 | $27,800 | $214,400 |
| 2019 | $5,530 | $242,200 | $27,800 | $214,400 |
| 2018 | $5,468 | $214,300 | $23,900 | $190,400 |
| 2017 | $4,960 | $214,300 | $23,900 | $190,400 |
| 2016 | $4,826 | $206,000 | $22,500 | $183,500 |
| 2015 | $4,826 | $206,000 | $22,500 | $183,500 |
| 2014 | $3,386 | $201,500 | $21,800 | $179,700 |
Source: Public Records
Map
Nearby Homes
- 2310 E 11th St
- 1916 York St
- 2318 E 11th St
- 2220 E 13th St
- 2102 York St
- 736 Guthrie Ave
- 2327 E 9th St
- 730 Guthrie Ave
- 2015 York St
- 1801 York St
- 1816 E 14th St
- 1400 Mattern Ave
- 542 Guthrie Ave
- 2342 York St
- 1614 E 13th St
- 1411 Guthrie Ave
- 810 E Washington Ave
- 1803 E 14th St
- 2415 E 13th St
- 2305 Saylor Rd
- 2011 E 9th St
- 909 Thompson Ave
- 911 Thompson Ave
- 2007 E 9th St
- 907 Thompson Ave
- 2001 E 9th St
- 2012 E 12th St
- 2008 E 12th St
- 2008&2006 E 12th St
- 2008 E 12th St Unit 2
- 906 Thompson Ave
- 2016 E 12th St
- 910 Thompson Ave
- 2020 E 12th St
- 2002 E 12th St
- 918 Thompson Ave
- 2006 E 12th St
- 1922 E 12th St
- 1104 Thompson Ave
- 1913 E 9th St
Your Personal Tour Guide
Ask me questions while you tour the home.