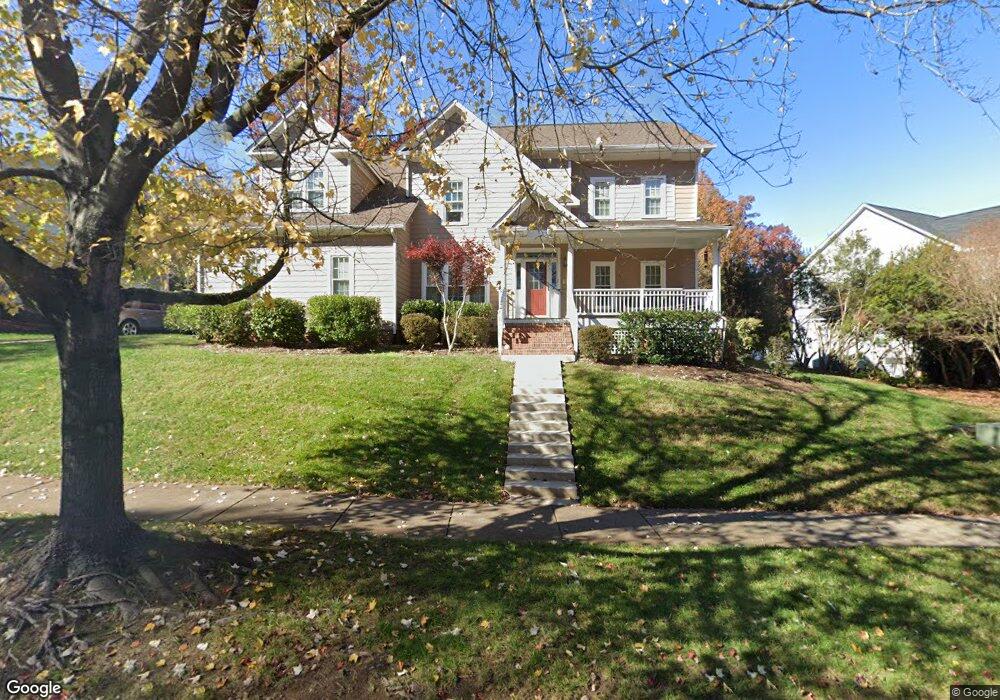
2015 Falls River Ave Raleigh, NC 27614
Falls River NeighborhoodEstimated Value: $680,000 - $713,029
5
Beds
3
Baths
3,116
Sq Ft
$221/Sq Ft
Est. Value
About This Home
This home is located at 2015 Falls River Ave, Raleigh, NC 27614 and is currently estimated at $689,257, approximately $221 per square foot. 2015 Falls River Ave is a home located in Wake County with nearby schools including Abbotts Creek Elementary School, East Millbrook Middle, and Millbrook High School.
Ownership History
Date
Name
Owned For
Owner Type
Purchase Details
Closed on
Jan 7, 2010
Sold by
Richard David and Richard Lynda
Bought by
Buff Jonathan Christopher and Buff Jennifer K Rieth
Current Estimated Value
Home Financials for this Owner
Home Financials are based on the most recent Mortgage that was taken out on this home.
Original Mortgage
$15,175
Outstanding Balance
$4,580
Interest Rate
4.68%
Mortgage Type
Credit Line Revolving
Estimated Equity
$684,677
Purchase Details
Closed on
Sep 3, 1999
Sold by
Parker & Lancaster Corp
Bought by
Richard David and Richard Lynda
Home Financials for this Owner
Home Financials are based on the most recent Mortgage that was taken out on this home.
Original Mortgage
$182,760
Interest Rate
6.75%
Purchase Details
Closed on
Jun 10, 1998
Sold by
Falls River Development Associates Ii Lt
Bought by
Brd Ltd Partnership
Create a Home Valuation Report for This Property
The Home Valuation Report is an in-depth analysis detailing your home's value as well as a comparison with similar homes in the area
Home Values in the Area
Average Home Value in this Area
Purchase History
| Date | Buyer | Sale Price | Title Company |
|---|---|---|---|
| Buff Jonathan Christopher | $304,000 | None Available | |
| Richard David | $263,000 | -- | |
| Brd Ltd Partnership | $40,000 | -- |
Source: Public Records
Mortgage History
| Date | Status | Borrower | Loan Amount |
|---|---|---|---|
| Open | Buff Jonathan Christopher | $15,175 | |
| Open | Buff Jonathan Christopher | $242,800 | |
| Previous Owner | Richard David | $182,760 |
Source: Public Records
Tax History Compared to Growth
Tax History
| Year | Tax Paid | Tax Assessment Tax Assessment Total Assessment is a certain percentage of the fair market value that is determined by local assessors to be the total taxable value of land and additions on the property. | Land | Improvement |
|---|---|---|---|---|
| 2025 | $5,753 | $657,416 | $135,000 | $522,416 |
| 2024 | $5,730 | $657,416 | $135,000 | $522,416 |
| 2023 | $4,379 | $399,912 | $91,000 | $308,912 |
| 2022 | $4,069 | $399,912 | $91,000 | $308,912 |
| 2021 | $3,911 | $399,912 | $91,000 | $308,912 |
| 2020 | $3,840 | $399,912 | $91,000 | $308,912 |
| 2019 | $4,005 | $343,850 | $86,000 | $257,850 |
| 2018 | $3,777 | $343,850 | $86,000 | $257,850 |
| 2017 | $3,597 | $343,850 | $86,000 | $257,850 |
| 2016 | $3,523 | $343,850 | $86,000 | $257,850 |
| 2015 | $3,576 | $343,388 | $86,000 | $257,388 |
| 2014 | $3,391 | $343,388 | $86,000 | $257,388 |
Source: Public Records
Map
Nearby Homes
- 10415 Ashmead Ln
- 1741 Farmington Grove Dr
- 10205 Sorrills Creek Ln
- 1700 Southwell Ct
- 2136 Dunn Rd
- 10209 River Bank Dr
- 10621 Catara Dr
- 4615 All Points View Way
- 10907 Flower Bed Ct
- 2313 Filigree Ct
- 10821 Farmville Rd
- 1804 Falls Landing Dr
- 4406 Crystal Breeze St
- 1808 Falls Landing Dr
- 2051 Dunn Rd
- 10943 Pendragon Place
- 1911 Falls Landing Dr Unit 103
- 1911 Falls Landing Dr Unit 106
- 10904 Fitzwilliam St
- 1310 Durlain Dr Unit 103
- 2009 Falls River Ave
- 10308 Watch Tower Ct
- 10308 Watchtower Ct
- 2005 Oakboro Dr
- 10401 Ashmead Ln
- 10312 Watchtower Ct
- 2001 Oakboro Dr
- 10405 Ashmead Ln
- 10316 Watchtower Ct
- 10317 Watchtower Ct
- 10409 Ashmead Ln
- 1920 Falls River Ave
- 1919 Oakboro Dr
- 10309 Watch Tower Ct
- 10309 Watchtower Ct
- 10313 Watchtower Ct
- 1900 Falls River Ave
- 10602 Candler Falls Ct
- 1915 Oakboro Dr
- 1920 Farmington Grove Dr