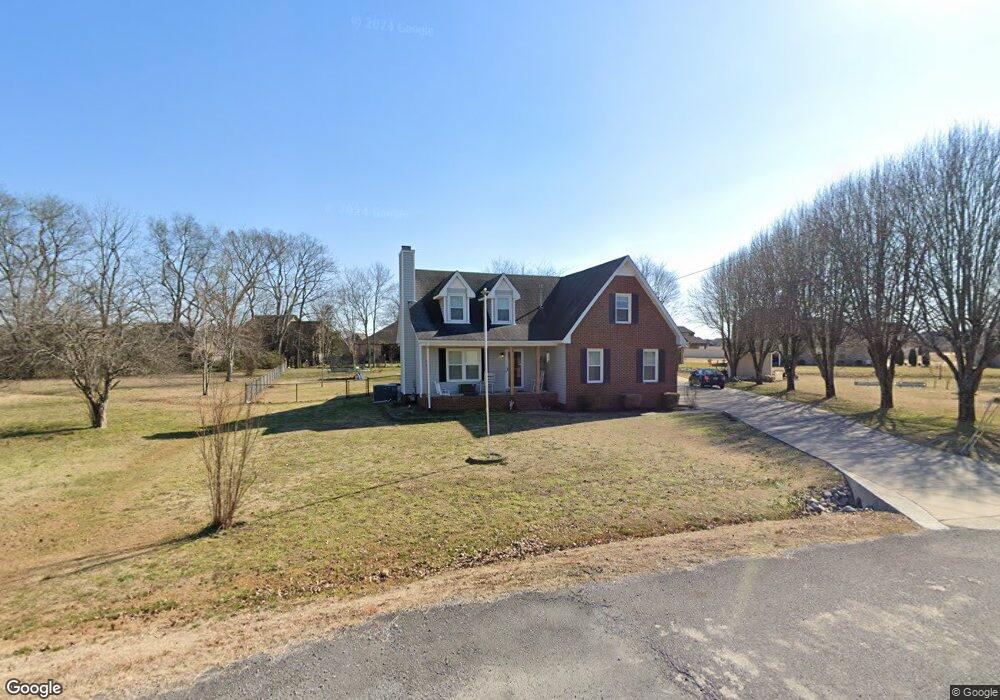
2015 Ivy Glen Dr Murfreesboro, TN 37128
Estimated Value: $348,643 - $448,000
--
Bed
3
Baths
1,529
Sq Ft
$266/Sq Ft
Est. Value
About This Home
This home is located at 2015 Ivy Glen Dr, Murfreesboro, TN 37128 and is currently estimated at $406,661, approximately $265 per square foot. 2015 Ivy Glen Dr is a home located in Rutherford County with nearby schools including Barfield Elementary School, Rockvale Middle School, and Rockvale High School.
Ownership History
Date
Name
Owned For
Owner Type
Purchase Details
Closed on
Jul 31, 2008
Sold by
Smith Walter C
Bought by
Albritton James S
Current Estimated Value
Home Financials for this Owner
Home Financials are based on the most recent Mortgage that was taken out on this home.
Original Mortgage
$118,000
Outstanding Balance
$77,046
Interest Rate
6.31%
Mortgage Type
Purchase Money Mortgage
Estimated Equity
$329,615
Purchase Details
Closed on
Sep 9, 1999
Sold by
Jager Charles N
Bought by
Smith Walter C and Smith Annette P
Home Financials for this Owner
Home Financials are based on the most recent Mortgage that was taken out on this home.
Original Mortgage
$129,900
Interest Rate
7.91%
Purchase Details
Closed on
Aug 27, 1997
Sold by
Curtis Richard E
Bought by
Jager Charles N and Jager Carol
Purchase Details
Closed on
Jan 13, 1994
Sold by
Ole South Properties Inc
Bought by
Curtis Richard A
Create a Home Valuation Report for This Property
The Home Valuation Report is an in-depth analysis detailing your home's value as well as a comparison with similar homes in the area
Home Values in the Area
Average Home Value in this Area
Purchase History
| Date | Buyer | Sale Price | Title Company |
|---|---|---|---|
| Albritton James S | $180,000 | -- | |
| Smith Walter C | $129,900 | -- | |
| Jager Charles N | $124,500 | -- | |
| Curtis Richard A | $95,000 | -- |
Source: Public Records
Mortgage History
| Date | Status | Borrower | Loan Amount |
|---|---|---|---|
| Open | Curtis Richard A | $118,000 | |
| Previous Owner | Curtis Richard A | $129,900 |
Source: Public Records
Tax History Compared to Growth
Tax History
| Year | Tax Paid | Tax Assessment Tax Assessment Total Assessment is a certain percentage of the fair market value that is determined by local assessors to be the total taxable value of land and additions on the property. | Land | Improvement |
|---|---|---|---|---|
| 2025 | $1,472 | $78,450 | $13,750 | $64,700 |
| 2024 | $1,472 | $78,450 | $13,750 | $64,700 |
| 2023 | $1,471 | $78,425 | $13,750 | $64,675 |
| 2022 | $1,268 | $78,425 | $13,750 | $64,675 |
| 2021 | $1,335 | $60,150 | $13,750 | $46,400 |
| 2020 | $1,335 | $60,150 | $13,750 | $46,400 |
| 2019 | $1,364 | $61,475 | $13,750 | $47,725 |
| 2018 | $1,291 | $61,475 | $0 | $0 |
| 2017 | $1,135 | $42,350 | $0 | $0 |
| 2016 | $1,135 | $42,350 | $0 | $0 |
| 2015 | $1,135 | $42,350 | $0 | $0 |
| 2014 | $1,053 | $42,350 | $0 | $0 |
| 2013 | -- | $38,850 | $0 | $0 |
Source: Public Records
Map
Nearby Homes
- 0 Audubon Ln Unit GTRTBD RTC2905239
- 35 Audubon Ln
- 36 Audubon Ln
- 57 Audubon Ln
- 6421 Desmond Ave
- 2316 Audubon Ln
- 2318 Audubon Ln Unit GTR050
- 2318 Audubon Ln
- 2210 Delafield Ct
- 2320 Audubon Ln
- 2320 Audubon Ln
- 2317 Audubon Ln
- 2323 Audubon Ln
- 2323 Audubon Ln Unit GTR066
- 2505 Ashebrook Ct
- 2617 Leawood Ct
- 2408 Audubon Ln
- 2406 Tredwell Ave
- 2622 Leawood Ct
- 2412 Audubon Ln
- 2118 Audubon Ln
- 2118 Audubon Ln
- 2118 Audubon Ln Unit 78
- 2118 Audubon Ln
- 2114 Audubon Ln
- 2114 Audubon Ln Unit 77
- 2114 Audubon Ln
- 2122 Audubon Ln
- 2122 Audubon Ln Unit 79
- 2122 Audubon Ln
- 2019 Ivy Glen Dr
- 2110 Audubon Ln
- 2003 Ivy Glen Dr
- 0 Audubon Ln Unit 1786621
- 0 Audubon Ln Unit RTC2796610
- 0 Audubon Ln Unit RTC2773840
- 0 Audubon Ln Unit RTC2773835
- 2014 Ivy Glen Dr
- 2126 Audubon Ln
- 2126 Audubon Ln