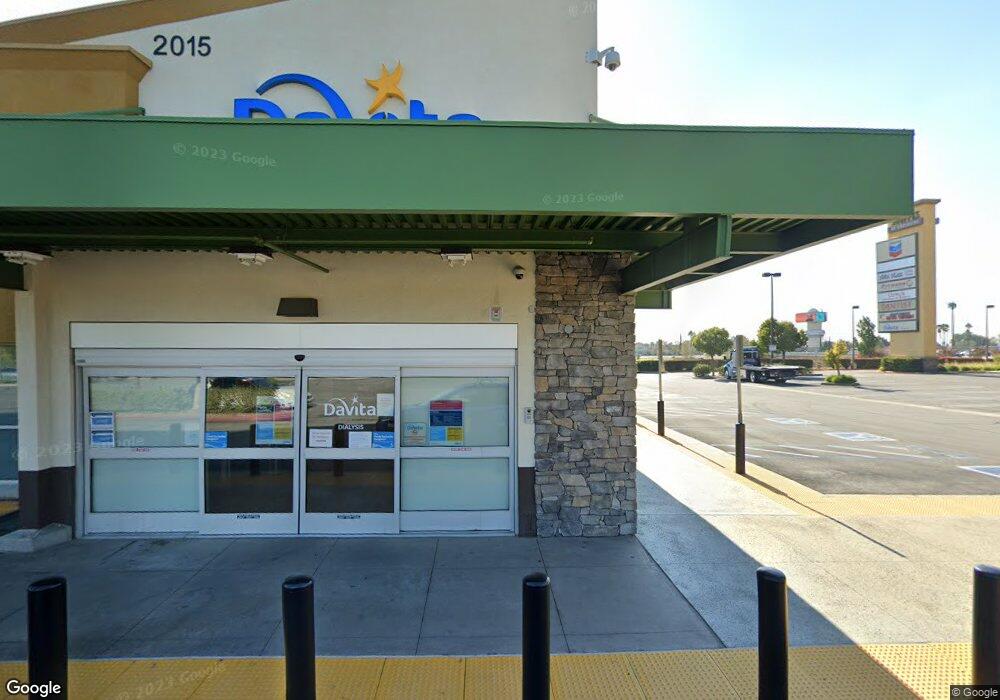
2015 N Riverside Ave Rialto, CA 92377
Estimated Value: $10,843,423
--
Bed
--
Bath
14,997
Sq Ft
$723/Sq Ft
Est. Value
About This Home
This home is located at 2015 N Riverside Ave, Rialto, CA 92377 and is currently estimated at $10,843,423, approximately $723 per square foot. 2015 N Riverside Ave is a home located in San Bernardino County with nearby schools including Elizabeth T. Hughbanks Elementary School, Kolb Middle School, and Wilmer Amina Carter High School.
Ownership History
Date
Name
Owned For
Owner Type
Purchase Details
Closed on
Apr 9, 2018
Sold by
Padova James A and Padova Marilyn A
Bought by
Hiro Holdings Llc
Current Estimated Value
Home Financials for this Owner
Home Financials are based on the most recent Mortgage that was taken out on this home.
Original Mortgage
$3,600,000
Outstanding Balance
$3,095,220
Interest Rate
4.43%
Mortgage Type
Commercial
Estimated Equity
$7,748,203
Purchase Details
Closed on
Mar 1, 2017
Sold by
Wang Tung Hsun and Wang Ying Lang
Bought by
Padova James A and Padova Marilyn A
Home Financials for this Owner
Home Financials are based on the most recent Mortgage that was taken out on this home.
Original Mortgage
$3,100,000
Interest Rate
4.19%
Mortgage Type
Commercial
Purchase Details
Closed on
Jul 31, 2012
Sold by
The Shoppes At Creekside Llc
Bought by
Wang Tung Hsun and Wang Ying Lang
Create a Home Valuation Report for This Property
The Home Valuation Report is an in-depth analysis detailing your home's value as well as a comparison with similar homes in the area
Home Values in the Area
Average Home Value in this Area
Purchase History
| Date | Buyer | Sale Price | Title Company |
|---|---|---|---|
| Hiro Holdings Llc | $6,455,000 | Commonwealth Land Title Comp | |
| Padova James A | $3,015,000 | Commonwealth Land Title | |
| Wang Tung Hsun | $2,589,000 | Chicago Title Company |
Source: Public Records
Mortgage History
| Date | Status | Borrower | Loan Amount |
|---|---|---|---|
| Open | Hiro Holdings Llc | $3,600,000 | |
| Previous Owner | Padova James A | $3,100,000 |
Source: Public Records
Tax History Compared to Growth
Tax History
| Year | Tax Paid | Tax Assessment Tax Assessment Total Assessment is a certain percentage of the fair market value that is determined by local assessors to be the total taxable value of land and additions on the property. | Land | Improvement |
|---|---|---|---|---|
| 2025 | $87,430 | $7,344,688 | $1,251,611 | $6,093,077 |
| 2024 | $87,430 | $7,200,675 | $1,227,070 | $5,973,605 |
| 2023 | $93,334 | $7,059,485 | $1,203,010 | $5,856,475 |
| 2022 | $86,578 | $6,921,064 | $1,179,422 | $5,741,642 |
| 2021 | $86,016 | $6,785,357 | $1,156,296 | $5,629,061 |
| 2020 | $86,599 | $6,715,782 | $1,144,440 | $5,571,342 |
| 2019 | $84,599 | $6,584,100 | $1,122,000 | $5,462,100 |
| 2018 | $39,158 | $3,075,300 | $918,000 | $2,157,300 |
| 2017 | $35,412 | $2,746,916 | $626,015 | $2,120,901 |
| 2016 | $35,013 | $2,693,055 | $613,740 | $2,079,315 |
| 2015 | $35,165 | $2,652,603 | $604,521 | $2,048,082 |
| 2014 | $33,050 | $2,600,642 | $592,679 | $2,007,963 |
Source: Public Records
Map
Nearby Homes
- 1973 N Sage Ave
- 2335 Powell Dr
- 301 W Easton St
- 2451 Gunner Ridge Way
- 1839 N Millard Ave
- 6210 Riverside Ave
- 178 W Walnut Ave Unit D
- 178 W Walnut Ave Unit C
- 1788 N Acacia Ave
- 2434 Gunner Ridge Way
- 2450 Gunner Ridge Way
- 2448 Gunner Ridge Way
- 2446 Gunner Ridge Way
- 2444 Gunner Ridge Way
- 2454 Gunner Ridge Way
- 2456 Gunner Ridge Way
- 2447 Gunner Ridge Way
- 2449 Gunner Ridge Way
- 2461 Gunner Ridge Way
- 2459 Gunner Ridge Way
- 173 E Arbeth St
- 161 E Arbeth St
- 187 E Arbeth St
- 2019 N Riverside Ave
- 149 E Arbeth St
- 199 E Arbeth St
- 137 E Arbeth St
- 213 E Arbeth St
- 123 E Arbeth St
- 227 E Arbeth St
- 2131 N Date Ave
- 2003 N Riverside Ave
- 2132 N Date Ave
- 2132 N Magnolia Ave
- 237 E Arbeth St
- 107 E Arbeth St
- 2145 N Date Ave
- 2146 N Date Ave
- 144 E Arbeth St
- 2146 N Magnolia Ave