2015 SE 5th St Des Moines, IA 50315
Indianola Hills NeighborhoodEstimated Value: $95,372 - $230,000
About This Home
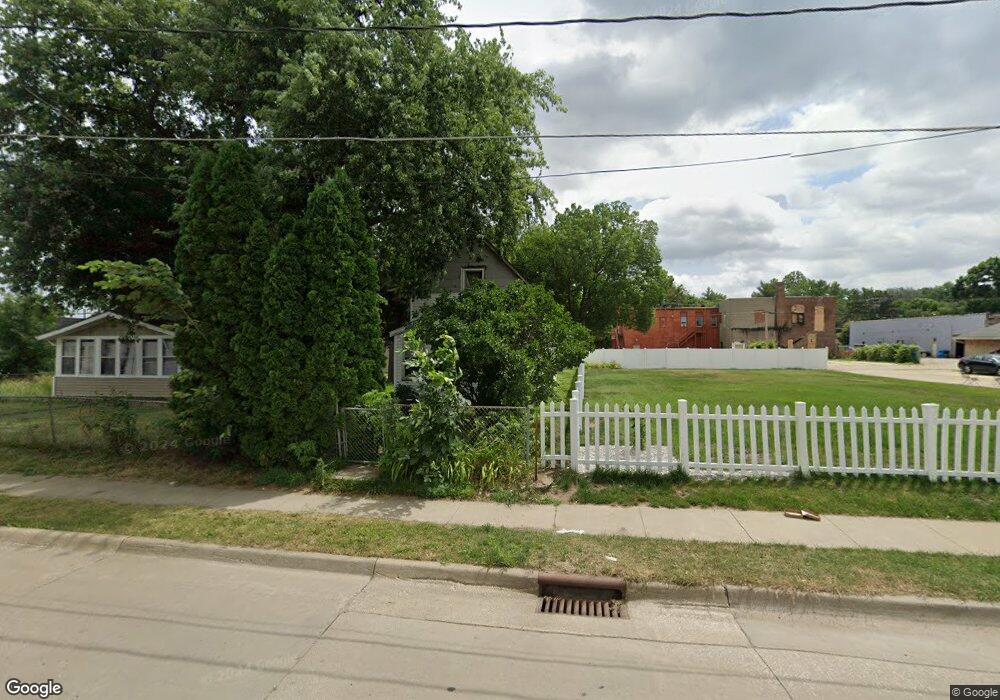
This home is located at 2015 SE 5th St, Des Moines, IA 50315 and is currently estimated at $158,093, approximately $215 per square foot. 2015 SE 5th St is a home located in Polk County with nearby schools including McKinley Elementary School, Weeks Middle School, and Lincoln High School.
Ownership History
We collect this data history from publicly available records. To have your information removed, we recommend requesting removal directly through your county’s website.
Purchase Details
Purchase Details
Home Values in the Area
Average Home Value in this Area
Purchase History
We collect this data history from publicly available records. To have your information removed, we recommend requesting removal directly through your county’s website.
| Date | Buyer | Sale Price | Title Company |
|---|---|---|---|
| -- | None Listed On Document | ||
| -- | None Listed On Document | ||
| -- | None Listed On Document | ||
| -- | None Listed On Document |
Tax History
We collect this data history from publicly available records. To have your information removed, we recommend requesting removal directly through your county’s website.
| Year | Tax Paid | Tax Assessment Tax Assessment Total Assessment is a certain percentage of the fair market value that is determined by local assessors to be the total taxable value of land and additions on the property. | Land | Improvement |
|---|---|---|---|---|
| 2025 | $966 | $68,900 | $11,700 | $57,200 |
| 2024 | $966 | $59,600 | $10,100 | $49,500 |
| 2023 | $938 | $59,600 | $10,100 | $49,500 |
| 2022 | $930 | $48,700 | $8,400 | $40,300 |
| 2021 | $876 | $48,700 | $8,400 | $40,300 |
| 2020 | $904 | $43,700 | $7,600 | $36,100 |
| 2019 | $894 | $43,700 | $7,600 | $36,100 |
| 2018 | $880 | $41,800 | $7,100 | $34,700 |
| 2017 | $760 | $41,800 | $7,100 | $34,700 |
| 2016 | $734 | $36,600 | $6,200 | $30,400 |
| 2015 | $734 | $36,600 | $6,200 | $30,400 |
| 2014 | $766 | $38,800 | $6,500 | $32,300 |
Map
- 6 Hartford Ave
- 2023 SE 6th St
- 320 E Gray St
- 818 E Edison Ave
- 425 E Granger Ave
- 417 E Granger Ave
- 2343 SE 5th St
- 2327 SE 8th St
- 2400 SE 8th St
- 300 E Granger Ave
- 2413 SE 8th St
- 211 E Granger Ave
- 343 E Bell Ave
- 2503 SE 5th St
- 1812 SE 2nd St
- 302 E Bell Ave
- 2519 SE 6th St
- 205 E Livingston Ave
- 2528 SE 6th St
- 124 E Bell Ave
- 2013 SE 5th St
- 501 Hartford Ave
- 507 Hartford Ave
- 509 Hartford Ave
- 2002 SE 5th St
- 2025 SE 5th St
- 2014 SE 6th St
- 2027 SE 5th St
- 2004 SE 6th St
- 2041 SE 5th St
- 2000 SE 6th St
- 440 Hartford Ave
- 431 Hartford Ave
- 2104 SE 6th St
- 1938 SE 6th St
- 2021 SE 6th St
- 2005 SE 6th St
- 429 Hartford Ave
- 432 Hartford Ave
- 2013 SE 6th St
Ask me questions while you tour the home.