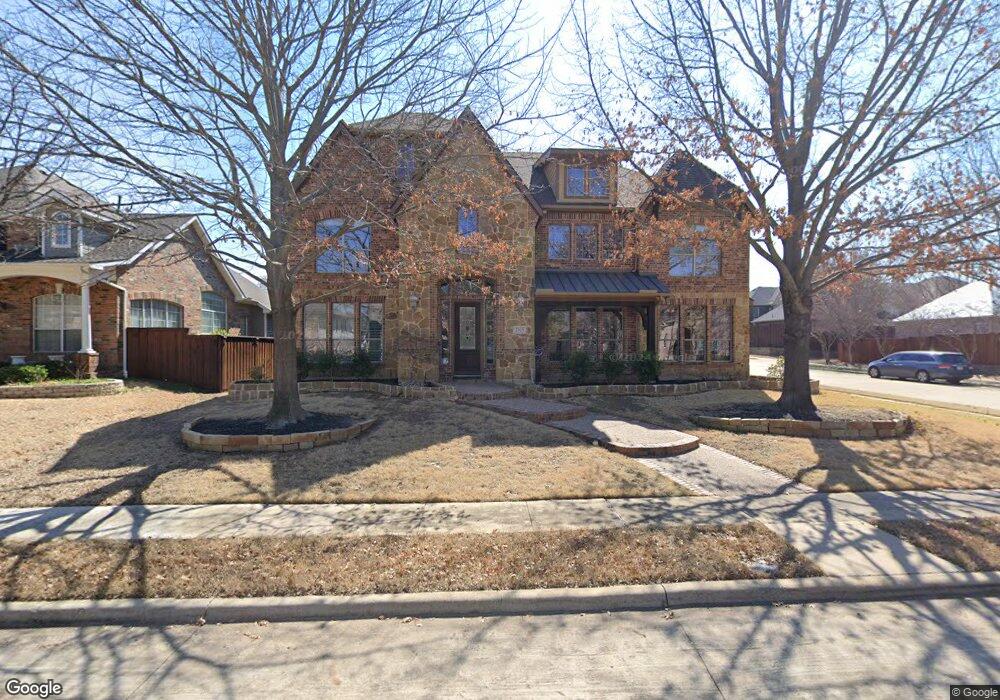
2015 Stonemont Ct Allen, TX 75013
Twin Creeks NeighborhoodEstimated Value: $828,000 - $883,208
5
Beds
4
Baths
4,428
Sq Ft
$193/Sq Ft
Est. Value
About This Home
This home is located at 2015 Stonemont Ct, Allen, TX 75013 and is currently estimated at $854,052, approximately $192 per square foot. 2015 Stonemont Ct is a home located in Collin County with nearby schools including Mary Evans Elementary School, Ereckson Middle School, and Lowery Freshman Center.
Ownership History
Date
Name
Owned For
Owner Type
Purchase Details
Closed on
Sep 20, 2010
Sold by
Castiglione Claude and Castiglione Catherine
Bought by
Nixon Bowdish Kathleen A and Bowdish Bruce
Current Estimated Value
Home Financials for this Owner
Home Financials are based on the most recent Mortgage that was taken out on this home.
Original Mortgage
$351,000
Outstanding Balance
$232,598
Interest Rate
4.51%
Mortgage Type
New Conventional
Estimated Equity
$621,454
Purchase Details
Closed on
Dec 30, 2002
Sold by
Grand Homes 2000 Lp
Bought by
Castiglione Claude
Home Financials for this Owner
Home Financials are based on the most recent Mortgage that was taken out on this home.
Original Mortgage
$289,600
Interest Rate
5.96%
Purchase Details
Closed on
Jul 17, 2002
Sold by
Shaddock Developers Ltd
Bought by
Grand Homes 2000 Lp
Home Financials for this Owner
Home Financials are based on the most recent Mortgage that was taken out on this home.
Original Mortgage
$25,000,000
Interest Rate
6.69%
Mortgage Type
Construction
Create a Home Valuation Report for This Property
The Home Valuation Report is an in-depth analysis detailing your home's value as well as a comparison with similar homes in the area
Home Values in the Area
Average Home Value in this Area
Purchase History
| Date | Buyer | Sale Price | Title Company |
|---|---|---|---|
| Nixon Bowdish Kathleen A | -- | Stnt | |
| Castiglione Claude | -- | -- | |
| Grand Homes 2000 Lp | -- | -- |
Source: Public Records
Mortgage History
| Date | Status | Borrower | Loan Amount |
|---|---|---|---|
| Open | Nixon Bowdish Kathleen A | $351,000 | |
| Previous Owner | Castiglione Claude | $289,600 | |
| Previous Owner | Grand Homes 2000 Lp | $25,000,000 |
Source: Public Records
Tax History Compared to Growth
Tax History
| Year | Tax Paid | Tax Assessment Tax Assessment Total Assessment is a certain percentage of the fair market value that is determined by local assessors to be the total taxable value of land and additions on the property. | Land | Improvement |
|---|---|---|---|---|
| 2025 | $11,231 | $765,547 | $189,000 | $576,547 |
| 2024 | $11,231 | $717,409 | $189,000 | $638,675 |
| 2023 | $11,231 | $652,190 | $157,500 | $660,500 |
| 2022 | $11,771 | $592,900 | $131,250 | $548,285 |
| 2021 | $11,460 | $539,000 | $110,250 | $428,750 |
| 2020 | $11,263 | $511,000 | $99,750 | $411,250 |
| 2019 | $11,319 | $490,000 | $99,750 | $390,250 |
| 2018 | $11,525 | $490,000 | $99,750 | $390,250 |
| 2017 | $10,914 | $495,261 | $99,750 | $395,511 |
| 2016 | $10,921 | $455,121 | $89,250 | $365,871 |
| 2015 | $9,286 | $424,258 | $78,750 | $345,508 |
Source: Public Records
Map
Nearby Homes
- 2006 Glenmere Dr
- 2010 Appleseed Dr
- 2020 Artemis Ct
- 804 Kimball Ct
- 9320 Cedardale Dr
- 2501 Royal Troon Dr
- 401 Bastrop Dr
- 2508 Royal Troon Dr
- 504 Bristol Dr
- 9212 Longview Dr
- 2508 Heather Glen Dr
- 1320 Caliche Trail
- Boyd - SH 5230 Plan at Custer Ridge Estates
- Pittsburg - SH 5410 Plan at Custer Ridge Estates
- Lakeway - SH 5414 Plan at Custer Ridge Estates
- Stafford - SH 5246 Plan at Custer Ridge Estates
- Huntington - SH 5426 Plan at Custer Ridge Estates
- Conroe - SH 5248 Plan at Custer Ridge Estates
- Ames - SH 5254 Plan at Custer Ridge Estates
- Lakeport - SH 5430 Plan at Custer Ridge Estates
- 2013 Stonemont Ct
- 2011 Stonemont Ct
- 2014 Huntcliffe Ct
- 2017 Stonemont Ct
- 2012 Huntcliffe Ct
- 2014 Stonemont Ct
- 2016 Stonemont Ct
- 2012 Stonemont Ct
- 2010 Huntcliffe Ct
- 2016 Huntcliffe Ct
- 2009 Stonemont Ct
- 2018 Stonemont Ct
- 2019 Stonemont Ct
- 2010 Stonemont Ct
- 2008 Huntcliffe Ct
- 2018 Huntcliffe Ct
- 2020 Stonemont Ct
- 2007 Stonemont Ct
- 2021 Stonemont Ct
- 2008 Stonemont Ct