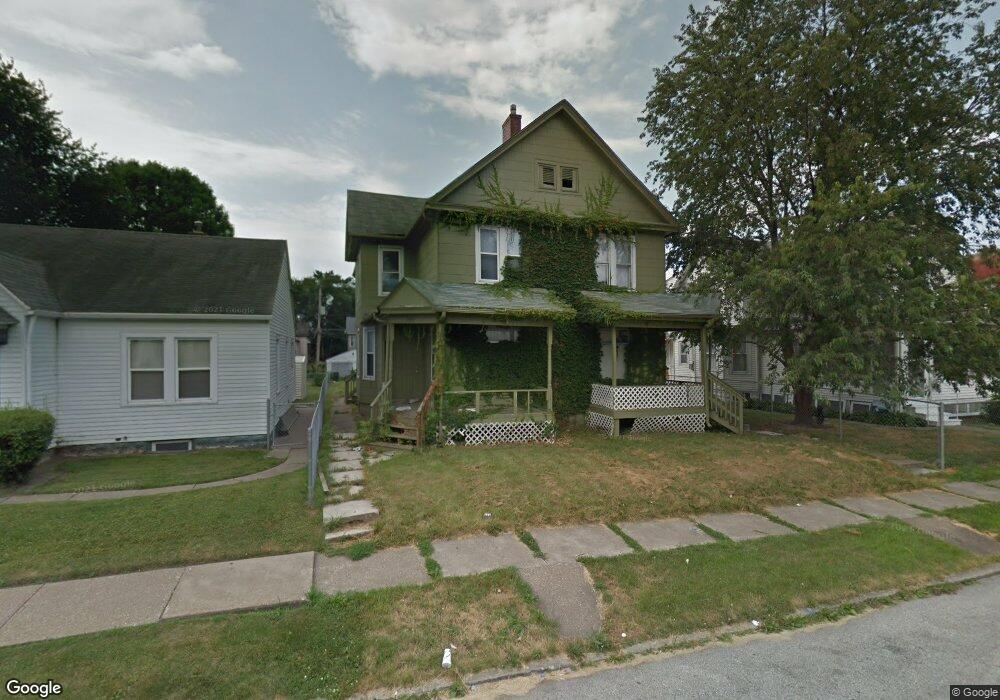
2015 W 6th St Davenport, IA 52802
Fejervary NeighborhoodEstimated Value: $119,855 - $138,000
8
Beds
2
Baths
2,660
Sq Ft
$48/Sq Ft
Est. Value
About This Home
This home is located at 2015 W 6th St, Davenport, IA 52802 and is currently estimated at $128,964, approximately $48 per square foot. 2015 W 6th St is a home located in Scott County with nearby schools including Walnut Hill Elementary School, South Christian Elementary School, and Wilson Elementary School.
Ownership History
Date
Name
Owned For
Owner Type
Purchase Details
Closed on
Jan 15, 2016
Sold by
Ffg Partners Llc
Bought by
Chasco Llc
Current Estimated Value
Purchase Details
Closed on
Oct 29, 2014
Sold by
Johnson William L and Johnson Alecia A
Bought by
Ffg Partners Llc 16
Purchase Details
Closed on
Mar 14, 2007
Sold by
Federal National Mortgage Association
Bought by
Johnson William L and Johnson Alecia A
Home Financials for this Owner
Home Financials are based on the most recent Mortgage that was taken out on this home.
Original Mortgage
$40,000
Interest Rate
6.31%
Mortgage Type
Credit Line Revolving
Purchase Details
Closed on
Dec 4, 2006
Sold by
Countrywide Home Loans Inc
Bought by
Federal National Mortgage Association
Purchase Details
Closed on
Nov 15, 2006
Sold by
Maly Melinda J and Eyre Maly Melinda J
Bought by
Countrywide Home Loans Inc
Create a Home Valuation Report for This Property
The Home Valuation Report is an in-depth analysis detailing your home's value as well as a comparison with similar homes in the area
Home Values in the Area
Average Home Value in this Area
Purchase History
| Date | Buyer | Sale Price | Title Company |
|---|---|---|---|
| Chasco Llc | $50,000 | None Available | |
| Ffg Partners Llc 16 | $6,110 | None Available | |
| Johnson William L | -- | None Available | |
| Federal National Mortgage Association | -- | None Available | |
| Countrywide Home Loans Inc | $71,050 | None Available |
Source: Public Records
Mortgage History
| Date | Status | Borrower | Loan Amount |
|---|---|---|---|
| Previous Owner | Johnson William L | $40,000 |
Source: Public Records
Tax History Compared to Growth
Tax History
| Year | Tax Paid | Tax Assessment Tax Assessment Total Assessment is a certain percentage of the fair market value that is determined by local assessors to be the total taxable value of land and additions on the property. | Land | Improvement |
|---|---|---|---|---|
| 2025 | $1,824 | $126,000 | $11,250 | $114,750 |
| 2024 | $1,780 | $102,040 | $11,250 | $90,790 |
| 2023 | $1,610 | $102,040 | $11,250 | $90,790 |
| 2022 | $1,616 | $75,350 | $11,250 | $64,100 |
| 2021 | $1,616 | $75,350 | $11,250 | $64,100 |
| 2020 | $1,606 | $73,930 | $11,250 | $62,680 |
| 2019 | $1,530 | $68,230 | $11,250 | $56,980 |
| 2018 | $1,498 | $68,230 | $11,250 | $56,980 |
| 2017 | $1,552 | $68,230 | $11,250 | $56,980 |
| 2016 | $1,425 | $51,140 | $0 | $0 |
| 2015 | $1,120 | $65,630 | $0 | $0 |
| 2014 | $1,458 | $65,630 | $0 | $0 |
| 2013 | $1,432 | $0 | $0 | $0 |
| 2012 | -- | $73,730 | $9,260 | $64,470 |
Source: Public Records
Map
Nearby Homes