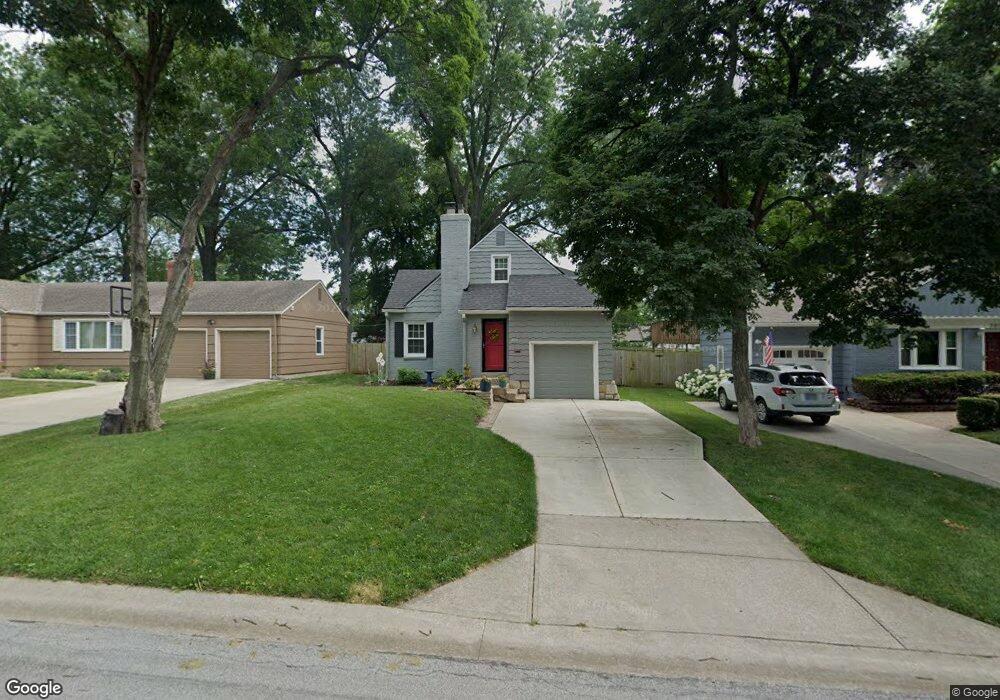
2015 W 73rd Terrace Prairie Village, KS 66208
Estimated Value: $388,000 - $476,000
3
Beds
2
Baths
1,494
Sq Ft
$289/Sq Ft
Est. Value
About This Home
This home is located at 2015 W 73rd Terrace, Prairie Village, KS 66208 and is currently estimated at $431,664, approximately $288 per square foot. 2015 W 73rd Terrace is a home located in Johnson County with nearby schools including Belinder Elementary School, Indian Hills Middle School, and Shawnee Mission East High School.
Ownership History
Date
Name
Owned For
Owner Type
Purchase Details
Closed on
May 28, 2019
Sold by
Wells Clay and Wells Ken E
Bought by
Hamilton Homes Llc
Current Estimated Value
Purchase Details
Closed on
Oct 9, 2012
Sold by
Broderick Keri E and Wells Keri E
Bought by
Wells Keri E and Wells Clay
Home Financials for this Owner
Home Financials are based on the most recent Mortgage that was taken out on this home.
Original Mortgage
$168,750
Interest Rate
3.61%
Mortgage Type
New Conventional
Purchase Details
Closed on
Mar 22, 2006
Sold by
Scholder Stephen Paul and Scholder Sarah
Bought by
Broaderick Keri
Home Financials for this Owner
Home Financials are based on the most recent Mortgage that was taken out on this home.
Original Mortgage
$160,000
Interest Rate
6.21%
Mortgage Type
New Conventional
Create a Home Valuation Report for This Property
The Home Valuation Report is an in-depth analysis detailing your home's value as well as a comparison with similar homes in the area
Home Values in the Area
Average Home Value in this Area
Purchase History
| Date | Buyer | Sale Price | Title Company |
|---|---|---|---|
| Hamilton Homes Llc | -- | Continental Title Company | |
| Wells Keri E | -- | Chicago Title Co Incs | |
| Broaderick Keri | -- | Chicago Title Insurance Co |
Source: Public Records
Mortgage History
| Date | Status | Borrower | Loan Amount |
|---|---|---|---|
| Previous Owner | Wells Keri E | $168,750 | |
| Previous Owner | Broaderick Keri | $160,000 |
Source: Public Records
Tax History Compared to Growth
Tax History
| Year | Tax Paid | Tax Assessment Tax Assessment Total Assessment is a certain percentage of the fair market value that is determined by local assessors to be the total taxable value of land and additions on the property. | Land | Improvement |
|---|---|---|---|---|
| 2024 | $4,956 | $42,435 | $14,196 | $28,239 |
| 2023 | $4,952 | $41,860 | $13,525 | $28,335 |
| 2022 | $4,437 | $37,340 | $11,762 | $25,578 |
| 2021 | $3,944 | $31,326 | $10,690 | $20,636 |
| 2020 | $4,020 | $31,671 | $9,724 | $21,947 |
| 2019 | $3,900 | $30,441 | $8,103 | $22,338 |
| 2018 | $3,564 | $27,727 | $7,043 | $20,684 |
| 2017 | $3,418 | $26,243 | $5,871 | $20,372 |
| 2016 | $3,033 | $22,782 | $4,699 | $18,083 |
| 2015 | $2,969 | $22,563 | $4,699 | $17,864 |
| 2013 | -- | $22,241 | $4,476 | $17,765 |
Source: Public Records
Map
Nearby Homes
- 2004 W 72nd Terrace
- 1296 W 72nd Terrace
- 7251 Terrace St
- 1245 W 72nd St
- 7328 Booth St
- 2300 W 71st Terrace
- 2207 W 71st St
- 7216 Booth St
- 7437 Belinder Ave
- 7615 Terrace St
- 7416 Belleview Ave
- 2624 W 75th Place
- 7632 Rainbow Dr
- 1911 Romany Rd
- 1127 W 76th Terrace
- 7444 Cherokee Dr
- 2807 W 71st Terrace
- 7620 Ward Pkwy
- 826 W 75th St
- 7217 Madison Ave
- 2017 W 73 Terrace
- 2017 W 73rd Terrace
- 2011 W 73rd Terrace
- 2101 W 73rd Terrace
- 2001 W 73rd Terrace
- 2020 W 74th St
- 2008 W 74th St
- 2115 W 73rd Terrace
- 2014 W 73rd Terrace
- 2008 W 73rd Terrace
- 1912 W 74th St
- 2020 W 73rd Terrace
- 2004 W 73rd Terrace
- 1909 W 73rd Terrace
- 2004 W 73rd Terrace
- 2104 W 74th St
- 2100 W 73rd Terrace
- 2000 W 73rd Terrace
- 2119 W 73rd Terrace
- 1908 W 74th St