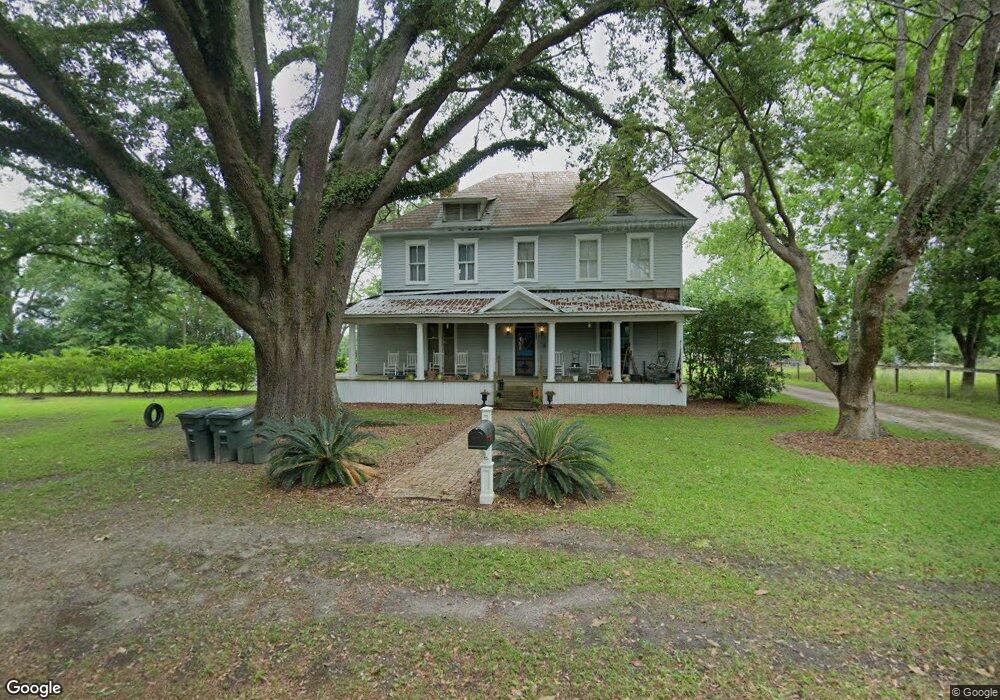
2015 Webster Rd Quitman, GA 31643
Estimated Value: $158,000 - $276,000
--
Bed
1
Bath
3,749
Sq Ft
$58/Sq Ft
Est. Value
About This Home
This home is located at 2015 Webster Rd, Quitman, GA 31643 and is currently estimated at $217,587, approximately $58 per square foot. 2015 Webster Rd is a home located in Brooks County with nearby schools including Quitman Elementary School and First Baptist Church Preschool & Kindergarten.
Ownership History
Date
Name
Owned For
Owner Type
Purchase Details
Closed on
Aug 24, 2018
Sold by
Wilson Dennis
Bought by
Williams Brinson Matthew and Williams Brinson Christy
Current Estimated Value
Home Financials for this Owner
Home Financials are based on the most recent Mortgage that was taken out on this home.
Original Mortgage
$67,500
Interest Rate
4.5%
Mortgage Type
New Conventional
Purchase Details
Closed on
Sep 19, 2001
Sold by
Griffis Kathy S
Bought by
Wilson Dennis and Wilson Donna
Purchase Details
Closed on
Dec 6, 1995
Sold by
Coody Brenda
Bought by
Griffis Kathy S
Purchase Details
Closed on
Jan 5, 1993
Sold by
Phillips William Edward
Bought by
Coody Brenda
Purchase Details
Closed on
Jan 6, 1992
Sold by
Phillips William E and Phillips Rhonda N
Bought by
Phillips William Edward
Purchase Details
Closed on
Jul 2, 1991
Bought by
Phillips William E and Phillips Rhonda N
Create a Home Valuation Report for This Property
The Home Valuation Report is an in-depth analysis detailing your home's value as well as a comparison with similar homes in the area
Home Values in the Area
Average Home Value in this Area
Purchase History
| Date | Buyer | Sale Price | Title Company |
|---|---|---|---|
| Williams Brinson Matthew | $75,000 | -- | |
| Wilson Dennis | $59,000 | -- | |
| Griffis Kathy S | $20,000 | -- | |
| Coody Brenda | -- | -- | |
| Phillips William Edward | -- | -- | |
| Phillips William E | $35,200 | -- |
Source: Public Records
Mortgage History
| Date | Status | Borrower | Loan Amount |
|---|---|---|---|
| Closed | Williams Brinson Matthew | $67,500 |
Source: Public Records
Tax History Compared to Growth
Tax History
| Year | Tax Paid | Tax Assessment Tax Assessment Total Assessment is a certain percentage of the fair market value that is determined by local assessors to be the total taxable value of land and additions on the property. | Land | Improvement |
|---|---|---|---|---|
| 2024 | $1,964 | $61,920 | $12,280 | $49,640 |
| 2023 | $1,798 | $55,440 | $11,720 | $43,720 |
| 2022 | $1,563 | $42,120 | $11,160 | $30,960 |
| 2021 | $1,525 | $42,400 | $11,600 | $30,800 |
| 2020 | $1,178 | $42,400 | $11,600 | $30,800 |
| 2019 | $1,128 | $39,080 | $11,160 | $27,920 |
| 2018 | $1,119 | $38,320 | $10,400 | $27,920 |
| 2017 | $1,304 | $36,760 | $10,400 | $26,360 |
| 2016 | $1,335 | $36,760 | $10,400 | $26,360 |
| 2015 | -- | $36,520 | $10,400 | $26,120 |
| 2014 | -- | $36,520 | $10,400 | $26,120 |
| 2013 | -- | $36,520 | $10,400 | $26,120 |
Source: Public Records
Map
Nearby Homes
- 302 Waterside Dr
- 1002 N Madison St
- 714 Morris Ave
- 304 W Rountree St
- 602 N Webster St
- 621 N Court St
- 606 N Court St
- 503 N Culpepper St
- 802 W Lafayette St
- 000 E Gordon St
- 2434 Dunn Rd
- 309 Eastlake Dr
- 1103 W Railroad St
- 84 W Us
- 1306 E Screven St
- 237 Turkey Ridge Ln
- 5616 Empress Rd
- 1540 Dunn Rd
- 7747 Empress Rd
- 5199 U S 84
- 2084 Webster Rd
- 2081 Webster Rd
- 1965 Webster Rd
- 2098 Moultrie Hwy
- 1575 Moultrie Hwy
- 2285 Webster Rd
- 2371 Webster Rd
- 2431 Webster Rd
- 00 Moultrie Hwy
- 1776 Moultrie Hwy
- 1586 Webster Rd
- 2348 Moultrie Hwy
- 0000 110 Acres Moultrie Hwy
- 1340 Webster Rd
- 1271 Webster Rd
- 1200 N Court St
- 1200 N Court St Unit A
- 1200 N Court St
- 1234 Webster Rd
- 1212 N Court St