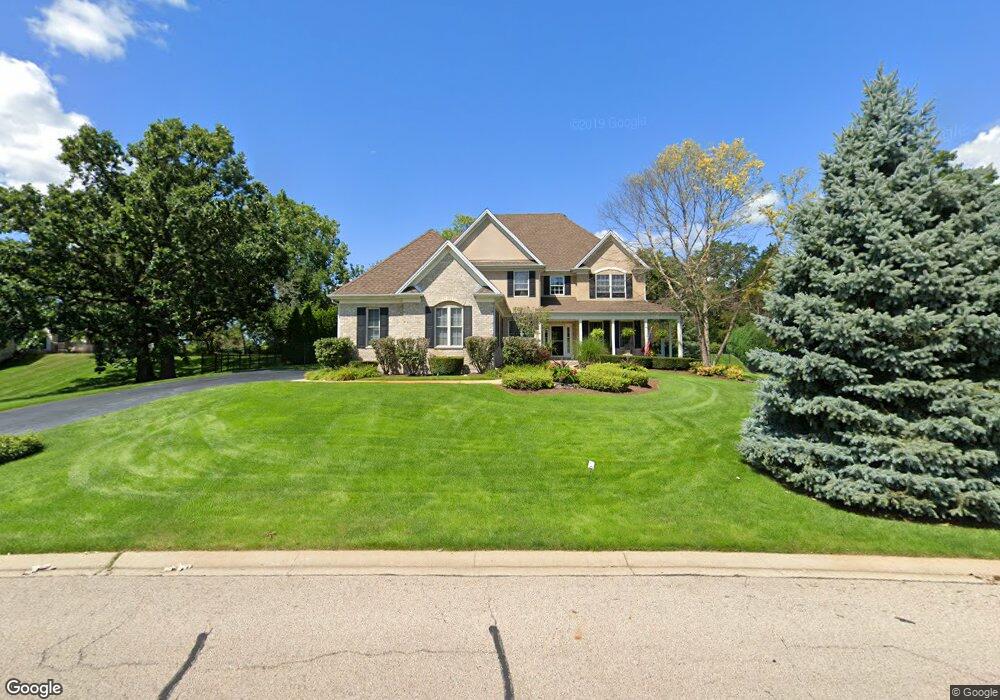
2016 Anthony Ln McHenry, IL 60051
Northwest Lakemoor NeighborhoodEstimated Value: $538,029 - $783,000
Studio
3
Baths
2,707
Sq Ft
$237/Sq Ft
Est. Value
About This Home
This home is located at 2016 Anthony Ln, McHenry, IL 60051 and is currently estimated at $641,757, approximately $237 per square foot. 2016 Anthony Ln is a home located in McHenry County with nearby schools including Hilltop Elementary School, Chauncey H Duker School, and Mchenry Middle School.
Ownership History
Date
Name
Owned For
Owner Type
Purchase Details
Closed on
Aug 18, 2003
Sold by
Bank Of Waukegan
Bought by
Rhoads Richard A and Rhoads Pamela M
Current Estimated Value
Home Financials for this Owner
Home Financials are based on the most recent Mortgage that was taken out on this home.
Original Mortgage
$322,700
Interest Rate
4%
Mortgage Type
Purchase Money Mortgage
Purchase Details
Closed on
Feb 13, 2001
Sold by
First Midwest Trust Company
Bought by
Bank Of Waukegan and Trust #204280
Home Financials for this Owner
Home Financials are based on the most recent Mortgage that was taken out on this home.
Original Mortgage
$225,000
Interest Rate
6.91%
Mortgage Type
Stand Alone Second
Create a Home Valuation Report for This Property
The Home Valuation Report is an in-depth analysis detailing your home's value as well as a comparison with similar homes in the area
Home Values in the Area
Average Home Value in this Area
Purchase History
| Date | Buyer | Sale Price | Title Company |
|---|---|---|---|
| Rhoads Richard A | $457,050 | Wheatland Title | |
| Bank Of Waukegan | $60,900 | Chicago Title |
Source: Public Records
Mortgage History
| Date | Status | Borrower | Loan Amount |
|---|---|---|---|
| Previous Owner | Rhoads Richard A | $322,700 | |
| Previous Owner | Bank Of Waukegan | $225,000 | |
| Closed | Rhoads Richard A | $111,450 |
Source: Public Records
Tax History
| Year | Tax Paid | Tax Assessment Tax Assessment Total Assessment is a certain percentage of the fair market value that is determined by local assessors to be the total taxable value of land and additions on the property. | Land | Improvement |
|---|---|---|---|---|
| 2024 | $13,122 | $173,181 | $31,956 | $141,225 |
| 2023 | $12,627 | $155,152 | $28,629 | $126,523 |
| 2022 | $12,429 | $143,939 | $26,560 | $117,379 |
| 2021 | $11,791 | $134,047 | $24,735 | $109,312 |
| 2020 | $11,359 | $128,459 | $23,704 | $104,755 |
| 2019 | $11,184 | $121,982 | $22,509 | $99,473 |
| 2018 | $12,351 | $116,450 | $21,488 | $94,962 |
| 2017 | $11,878 | $109,291 | $20,167 | $89,124 |
| 2016 | $10,917 | $97,231 | $18,848 | $78,383 |
| 2013 | -- | $92,086 | $18,556 | $73,530 |
Source: Public Records
Map
Nearby Homes
- 1801 Anthony Ln
- 2214 Truman Trail
- 2313 Eisenhower Blvd
- 1718 W Lincoln Rd
- 1606 W August Ln
- 2413 Country Ln
- 4408 Gray Wolf Cir
- 3237 Jori Ln
- 3315 Jori Ln
- 3202 Jori Ln
- 4505 Gray Wolf Cir
- 3214 Jori Ln
- 3233 Jori Ln
- 3307 Jori Ln
- 3118 N Chapel Hill Rd
- 0000 Fairview Ave
- 1515 N River Rd
- 3114 Chapel Hill Rd
- 1423 N River Rd
- 2323 W Fairview Ave
- 2012 Anthony Ln
- 2020 Julia Way
- 2015 Anthony Ln
- 2008 Anthony Ln
- 2002 Anthony Ln
- 2019 Julia Way
- 2106 N Chapel Hill Rd
- 1919 Anthony Ln
- 1920 Anthony Ln
- 2011 Julia Way
- 1918 Julia Way
- 2112 N Chapel Hill Rd
- 2111 N Pebble Dr
- 1915 Anthony Ln
- 2107 N Pebble Dr
- 1912 Anthony Ln
- 1914 Julia Way
- 2103 N Pebble Dr
- 2311 Tyler Trail
- 2005 Julia Way
Your Personal Tour Guide
Ask me questions while you tour the home.