Estimated Value: $136,000 - $258,000
3
Beds
1
Bath
1,170
Sq Ft
$172/Sq Ft
Est. Value
About This Home
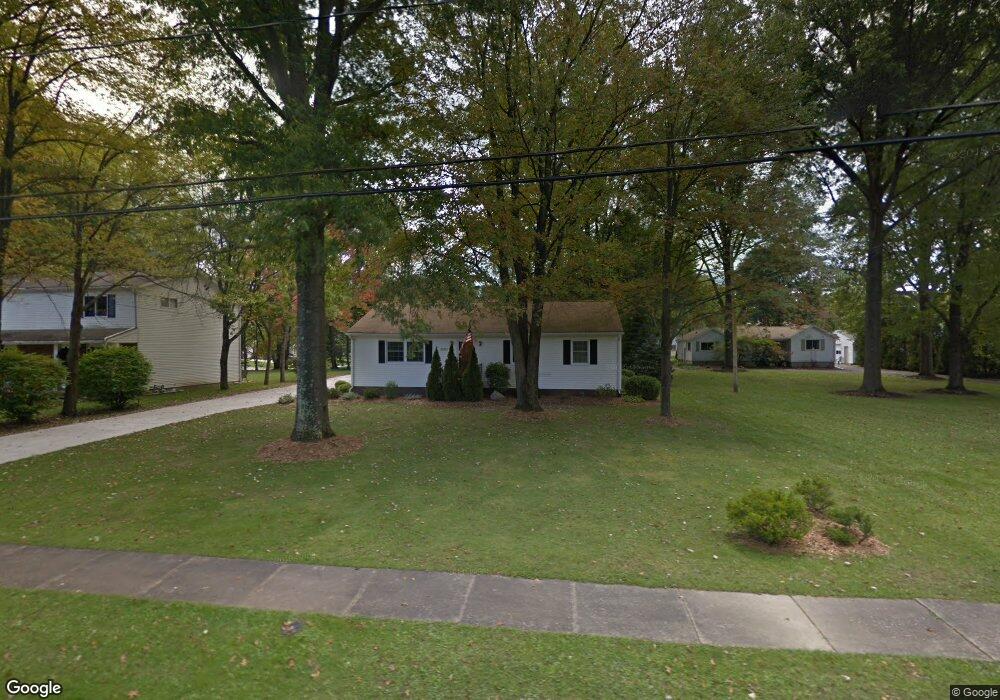
This home is located at 2016 Arndale Rd, Stow, OH 44224 and is currently estimated at $201,043, approximately $171 per square foot. 2016 Arndale Rd is a home located in Summit County with nearby schools including Stow-Munroe Falls High School, Primrose School of Hudson, and Holy Family Elementary School.
Ownership History
Date
Name
Owned For
Owner Type
Purchase Details
Closed on
May 16, 2023
Sold by
Pauley Timothy H and Pauley Koryne D
Bought by
Tassone Michael J
Current Estimated Value
Home Financials for this Owner
Home Financials are based on the most recent Mortgage that was taken out on this home.
Original Mortgage
$88,400
Outstanding Balance
$78,687
Interest Rate
5.64%
Mortgage Type
New Conventional
Estimated Equity
$122,356
Purchase Details
Closed on
Sep 15, 2003
Sold by
Hillyard Frank W and Hillyard Terri L
Bought by
Pauley Timothy H and Pauley Koryne D
Home Financials for this Owner
Home Financials are based on the most recent Mortgage that was taken out on this home.
Original Mortgage
$27,192
Interest Rate
6.44%
Mortgage Type
Purchase Money Mortgage
Create a Home Valuation Report for This Property
The Home Valuation Report is an in-depth analysis detailing your home's value as well as a comparison with similar homes in the area
Home Values in the Area
Average Home Value in this Area
Purchase History
| Date | Buyer | Sale Price | Title Company |
|---|---|---|---|
| Tassone Michael J | $111,000 | None Listed On Document | |
| Pauley Timothy H | $135,900 | -- |
Source: Public Records
Mortgage History
| Date | Status | Borrower | Loan Amount |
|---|---|---|---|
| Open | Tassone Michael J | $88,400 | |
| Previous Owner | Pauley Timothy H | $27,192 | |
| Closed | Pauley Timothy H | $108,768 |
Source: Public Records
Tax History Compared to Growth
Tax History
| Year | Tax Paid | Tax Assessment Tax Assessment Total Assessment is a certain percentage of the fair market value that is determined by local assessors to be the total taxable value of land and additions on the property. | Land | Improvement |
|---|---|---|---|---|
| 2025 | $2,941 | $51,703 | $10,602 | $41,101 |
| 2024 | $2,941 | $51,703 | $10,602 | $41,101 |
| 2023 | $2,941 | $51,703 | $10,602 | $41,101 |
| 2022 | $2,676 | $41,472 | $8,348 | $33,124 |
| 2021 | $2,398 | $41,472 | $8,348 | $33,124 |
| 2020 | $2,358 | $41,470 | $8,350 | $33,120 |
| 2019 | $2,486 | $40,930 | $8,350 | $32,580 |
| 2018 | $2,446 | $40,930 | $8,350 | $32,580 |
| 2017 | $2,334 | $40,930 | $8,350 | $32,580 |
| 2016 | $2,402 | $37,930 | $8,350 | $29,580 |
| 2015 | $2,334 | $37,930 | $8,350 | $29,580 |
| 2014 | $2,337 | $37,930 | $8,350 | $29,580 |
| 2013 | $2,274 | $37,160 | $8,350 | $28,810 |
Source: Public Records
Map
Nearby Homes
- 4424 Timberdale Dr Unit 4428
- 4462 Timberdale Dr
- 4322 Lorwood Dr
- 2055-2059 Bryn Mawr Dr
- 0 Stow Rd Unit 5102979
- 4630 Red Willow Rd
- 2260 E Gilwood Dr
- 1808 Higby Dr Unit A
- 2410 Wrens Dr S
- 2279 Becket Cir
- 3908 Stow Rd
- 2188 Duxbury
- 2140 Uniondale Dr
- 3961 Klein Ave
- 1784 Clearbrook Dr
- 4846 Garnet Cir
- 3901 Moreland Ave
- 4155 Burton Dr
- 4131 Burton Dr
- 1514 & 1516 Robin Ln
- 2024 Arndale Rd Unit 2028
- 2028 Arndale Rd
- 2006 Arndale Rd
- 4180 Chesterland Blvd
- 1998 Arndale Rd
- 4132 Chesterland Blvd
- 4140 Chesterland Blvd
- 2025 Arndale Rd
- 1994 Arndale Rd
- 4181 Chesterland Blvd
- 2048 Arndale Rd Unit 2052
- 2037 Arndale Rd
- 4124 Chesterland Blvd
- 2007 Arndale Rd
- 4175 Chesterland Blvd
- 4114 Chesterland Blvd
- 2019 Arndale Rd
- 1988 Arndale Rd
- 2062 Arndale Rd
- 4169 Chesterland Blvd