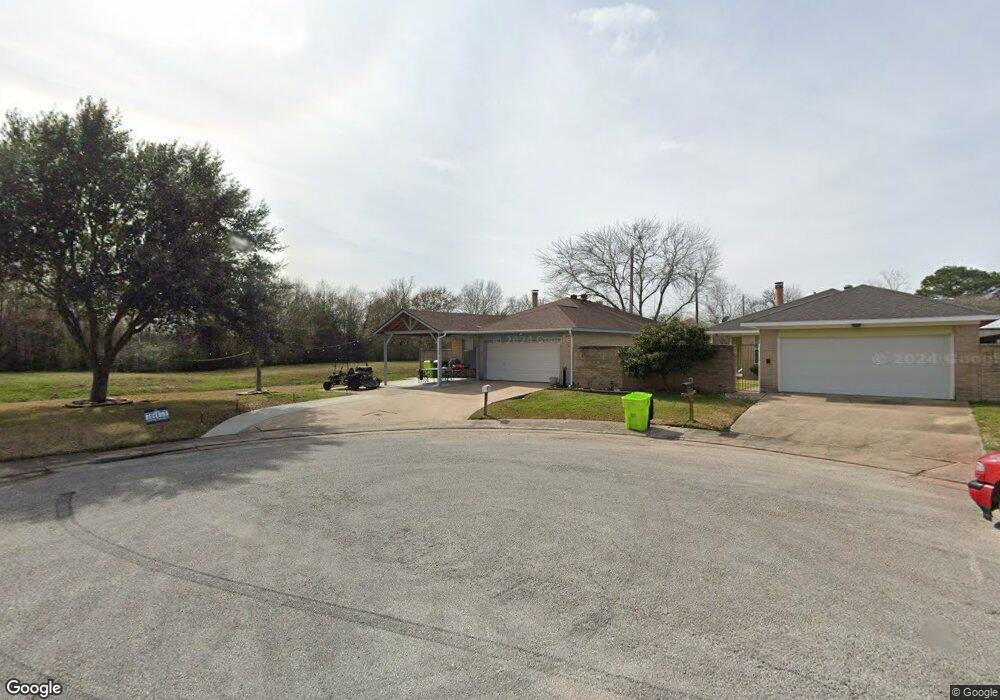
2016 Chelsea Ct Rosenberg, TX 77471
Estimated Value: $183,061 - $251,000
3
Beds
2
Baths
1,064
Sq Ft
$195/Sq Ft
Est. Value
About This Home
This home is located at 2016 Chelsea Ct, Rosenberg, TX 77471 and is currently estimated at $207,515, approximately $195 per square foot. 2016 Chelsea Ct is a home located in Fort Bend County with nearby schools including Taylor Ray Elementary School, Navarro Middle School, and George Junior High School.
Ownership History
Date
Name
Owned For
Owner Type
Purchase Details
Closed on
Sep 26, 2011
Sold by
Curz Alfredo and Cruz Patriica
Bought by
Garza Adeiana R
Current Estimated Value
Home Financials for this Owner
Home Financials are based on the most recent Mortgage that was taken out on this home.
Original Mortgage
$84,794
Outstanding Balance
$58,249
Interest Rate
4.25%
Mortgage Type
FHA
Estimated Equity
$149,266
Purchase Details
Closed on
Jun 11, 2009
Sold by
Federal Home Loan Mortgage Corporation
Bought by
Cruz Alfredo and Cruz Patricia
Purchase Details
Closed on
Feb 3, 2009
Sold by
Jeu Yat Sing T
Bought by
Federal Home Loan Mortgage Corp
Purchase Details
Closed on
Oct 13, 2003
Sold by
Kelly Charles H
Bought by
Jeu Yat Sing T
Home Financials for this Owner
Home Financials are based on the most recent Mortgage that was taken out on this home.
Original Mortgage
$58,000
Interest Rate
6.42%
Mortgage Type
Purchase Money Mortgage
Create a Home Valuation Report for This Property
The Home Valuation Report is an in-depth analysis detailing your home's value as well as a comparison with similar homes in the area
Home Values in the Area
Average Home Value in this Area
Purchase History
| Date | Buyer | Sale Price | Title Company |
|---|---|---|---|
| Garza Adeiana R | -- | Stewart Title | |
| Cruz Alfredo | -- | Stewart Title Richmond | |
| Garza Adriana R | -- | -- | |
| Federal Home Loan Mortgage Corp | $63,113 | None Available | |
| Garza Adriana R | -- | -- | |
| Jeu Yat Sing T | -- | Startex Title |
Source: Public Records
Mortgage History
| Date | Status | Borrower | Loan Amount |
|---|---|---|---|
| Open | Garza Adeiana R | $84,794 | |
| Previous Owner | Jeu Yat Sing T | $58,000 |
Source: Public Records
Tax History Compared to Growth
Tax History
| Year | Tax Paid | Tax Assessment Tax Assessment Total Assessment is a certain percentage of the fair market value that is determined by local assessors to be the total taxable value of land and additions on the property. | Land | Improvement |
|---|---|---|---|---|
| 2025 | $1,341 | $141,332 | $25,740 | $115,592 |
| 2024 | $1,341 | $142,913 | $17,940 | $124,973 |
| 2023 | $1,156 | $129,921 | $0 | $141,463 |
| 2022 | $1,732 | $118,110 | $6,830 | $111,280 |
| 2021 | $2,228 | $107,370 | $19,800 | $87,570 |
| 2020 | $2,198 | $103,570 | $19,800 | $83,770 |
| 2019 | $2,150 | $94,150 | $19,800 | $74,350 |
| 2018 | $1,987 | $85,590 | $19,800 | $65,790 |
| 2017 | $1,816 | $77,810 | $16,200 | $61,610 |
| 2016 | $1,754 | $75,150 | $16,200 | $58,950 |
| 2015 | $1,332 | $75,740 | $16,200 | $59,540 |
| 2014 | $1,461 | $74,430 | $16,200 | $58,230 |
Source: Public Records
Map
Nearby Homes
- 2012 Chelsea Ct
- 2020 Chelsea Ct
- 2008 Chelsea Ct
- 2004 Chelsea Ct
- 2000 Chelsea Ct
- 2021 Chelsea Ct
- 2013 Chelsea Ct
- 2009 Chelsea Ct
- 1924 Chelsea Ct
- 2005 Chelsea Ct
- 2005 Chelsea Ct
- 2016 Tremont Ct
- 1920 Chelsea Ct
- 2012 Tremont Ct
- 2008 Tremont Ct
- 2020 Tremont Ct
- 2004 Tremont Ct
- 1916 Chelsea Ct
- 2000 Tremont Ct
- 1924 Tremont Ct