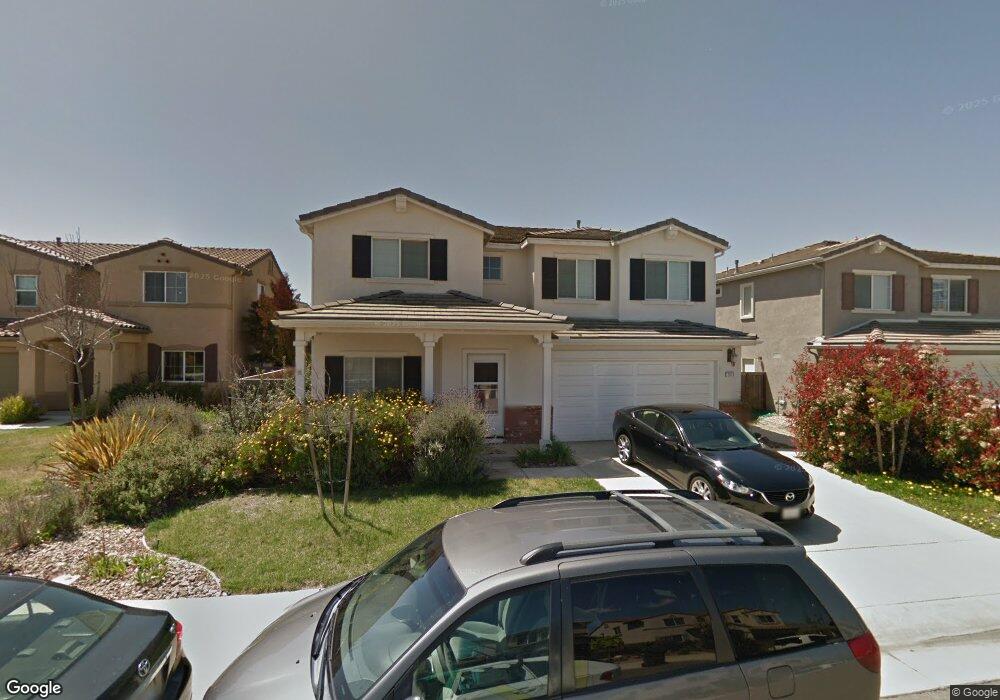
2016 Conception Dr Lompoc, CA 93436
Estimated Value: $717,037 - $744,000
4
Beds
3
Baths
2,386
Sq Ft
$306/Sq Ft
Est. Value
About This Home
This home is located at 2016 Conception Dr, Lompoc, CA 93436 and is currently estimated at $729,259, approximately $305 per square foot. 2016 Conception Dr is a home located in Santa Barbara County with nearby schools including Clarence Ruth Elementary School, Lompoc Valley Middle School, and Lompoc High School.
Ownership History
Date
Name
Owned For
Owner Type
Purchase Details
Closed on
Dec 6, 2023
Sold by
Worden Michael David and Worden Leovanna M
Bought by
Sifuentez Randolph and Sifuentez Christina
Current Estimated Value
Home Financials for this Owner
Home Financials are based on the most recent Mortgage that was taken out on this home.
Original Mortgage
$24,465
Outstanding Balance
$8,239
Interest Rate
5%
Mortgage Type
New Conventional
Estimated Equity
$721,020
Purchase Details
Closed on
Mar 3, 2008
Sold by
Centex Homes
Bought by
Worden Michael David and Worden Leovanna M
Home Financials for this Owner
Home Financials are based on the most recent Mortgage that was taken out on this home.
Original Mortgage
$396,342
Interest Rate
5.65%
Mortgage Type
VA
Create a Home Valuation Report for This Property
The Home Valuation Report is an in-depth analysis detailing your home's value as well as a comparison with similar homes in the area
Home Values in the Area
Average Home Value in this Area
Purchase History
| Date | Buyer | Sale Price | Title Company |
|---|---|---|---|
| Sifuentez Randolph | $699,000 | Fidelity National Title Compan | |
| Worden Michael David | -- | Commerce Title Company |
Source: Public Records
Mortgage History
| Date | Status | Borrower | Loan Amount |
|---|---|---|---|
| Open | Sifuentez Randolph | $24,465 | |
| Open | Sifuentez Randolph | $686,339 | |
| Previous Owner | Worden Michael David | $396,342 |
Source: Public Records
Tax History
| Year | Tax Paid | Tax Assessment Tax Assessment Total Assessment is a certain percentage of the fair market value that is determined by local assessors to be the total taxable value of land and additions on the property. | Land | Improvement |
|---|---|---|---|---|
| 2025 | $7,647 | $712,980 | $193,800 | $519,180 |
| 2023 | $7,647 | $489,839 | $176,743 | $313,096 |
| 2022 | $5,439 | $480,235 | $173,278 | $306,957 |
| 2021 | $5,502 | $470,820 | $169,881 | $300,939 |
| 2020 | $5,443 | $465,994 | $168,140 | $297,854 |
| 2019 | $5,354 | $456,858 | $164,844 | $292,014 |
| 2018 | $5,272 | $447,901 | $161,612 | $286,289 |
| 2017 | $5,177 | $439,120 | $158,444 | $280,676 |
| 2016 | $4,714 | $399,000 | $144,000 | $255,000 |
| 2014 | $3,956 | $330,000 | $119,000 | $211,000 |
Source: Public Records
Map
Nearby Homes
- 1103 Point Sal Loop
- 2205 Point Sal Loop
- 1416 Glen Ellen Ln
- 1212 Timothy Ct
- 1012 W Anthony Way
- 600 N Y St
- 1344 Village Meadows Dr
- 901 Alden Ave
- 516 N U St
- 420 N W St
- 1355 Crown Cir
- 321 N Z St
- 531 N O St
- 0 Floradale Ave
- 321 W North Ave Unit 133
- 112 N X St
- 1408 W Walnut Ave
- 267 Village Circle Dr
- 1011 W Walnut Ave
- 1410 W Apricot Ave
- 2012 Conception Dr
- 2020 Conception Dr
- 1114 Point Sal Loop
- 1118 Point Sal Loop
- 2008 Conception Dr
- 1110 Point Sal Loop
- 2009 Conception Dr
- 2013 Conception Dr
- 2005 Conception Dr
- 2023 San Antonio Ct
- 2029 Conception Dr
- 2033 Conception Dr
- 2001 Conception Dr
- 2019 San Antonio Ct
- 2017 Conception Dr
- 2025 Conception Dr
- 1114 Conception Dr
- 2021 Conception Dr
- 2301 Point Sal Loop
Your Personal Tour Guide
Ask me questions while you tour the home.