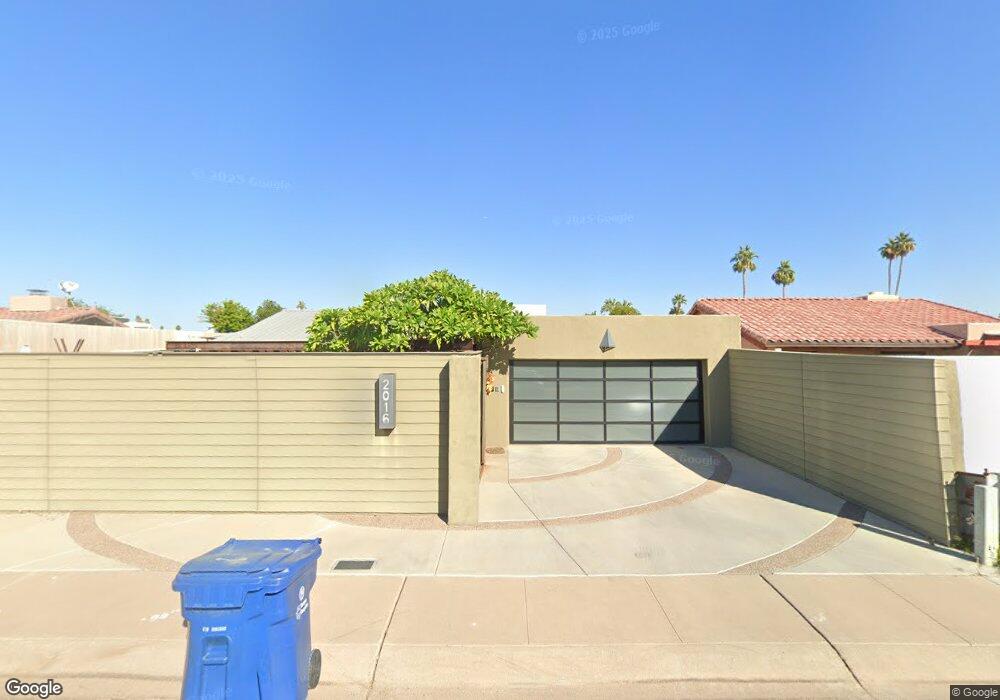
2016 E Cairo Dr Tempe, AZ 85282
Alameda NeighborhoodEstimated Value: $455,717 - $569,000
Studio
3
Baths
1,660
Sq Ft
$306/Sq Ft
Est. Value
About This Home
This home is located at 2016 E Cairo Dr, Tempe, AZ 85282 and is currently estimated at $508,429, approximately $306 per square foot. 2016 E Cairo Dr is a home located in Maricopa County with nearby schools including Curry Elementary School, Connolly Middle School, and McClintock High School.
Ownership History
Date
Name
Owned For
Owner Type
Purchase Details
Closed on
Jan 21, 2020
Sold by
Spears Rita L and Spears Linda
Bought by
Spears Revocable Trust
Current Estimated Value
Purchase Details
Closed on
Jul 2, 2007
Sold by
Spears Rita L and Spears Linda
Bought by
Spears Rita L and Spears Linda
Purchase Details
Closed on
Jun 4, 1999
Sold by
Salomon Bros Realty Corp
Bought by
Spears Linda and Spears Rita L
Home Financials for this Owner
Home Financials are based on the most recent Mortgage that was taken out on this home.
Original Mortgage
$130,050
Outstanding Balance
$34,185
Interest Rate
7.01%
Mortgage Type
New Conventional
Estimated Equity
$474,244
Purchase Details
Closed on
Mar 26, 1999
Sold by
Coulbourne James F and Coulbourne Susan
Bought by
Salomon Bros Realty Corp
Purchase Details
Closed on
Feb 6, 1997
Sold by
Coulbourne Susan
Bought by
Coulbourne James F
Create a Home Valuation Report for This Property
The Home Valuation Report is an in-depth analysis detailing your home's value as well as a comparison with similar homes in the area
Home Values in the Area
Average Home Value in this Area
Purchase History
| Date | Buyer | Sale Price | Title Company |
|---|---|---|---|
| Spears Revocable Trust | -- | None Available | |
| Spears Rita L | -- | None Available | |
| Spears Linda | $136,900 | Chicago Title Insurance Co | |
| Salomon Bros Realty Corp | -- | Tsg Title Agency Inc | |
| Coulbourne James F | -- | Security Title Agency |
Source: Public Records
Mortgage History
| Date | Status | Borrower | Loan Amount |
|---|---|---|---|
| Open | Spears Linda | $130,050 |
Source: Public Records
Tax History
| Year | Tax Paid | Tax Assessment Tax Assessment Total Assessment is a certain percentage of the fair market value that is determined by local assessors to be the total taxable value of land and additions on the property. | Land | Improvement |
|---|---|---|---|---|
| 2025 | $2,432 | $23,329 | -- | -- |
| 2024 | $2,232 | $22,218 | -- | -- |
| 2023 | $2,232 | $40,060 | $8,010 | $32,050 |
| 2022 | $2,131 | $30,910 | $6,180 | $24,730 |
| 2021 | $2,173 | $28,800 | $5,760 | $23,040 |
| 2020 | $2,101 | $26,380 | $5,270 | $21,110 |
| 2019 | $2,061 | $24,300 | $4,860 | $19,440 |
| 2018 | $2,005 | $22,630 | $4,520 | $18,110 |
| 2017 | $1,943 | $21,260 | $4,250 | $17,010 |
| 2016 | $1,933 | $21,100 | $4,220 | $16,880 |
| 2015 | $1,870 | $19,830 | $3,960 | $15,870 |
Source: Public Records
Map
Nearby Homes
- 1939 E Alameda Dr
- 3147 S Fairfield Dr
- 1874 E Geneva Dr
- 2015 E Southern Ave Unit 14
- 2015 E Southern Ave Unit 22
- 2015 E Southern Ave Unit 23
- 2912 S Price Rd
- 1986 E Palmcroft Dr
- 2132 E Broadmor Dr
- 2717 S Alder Dr
- 1959 E Laguna Dr
- 2226 S Kachina Dr
- 1941 E Pebble Beach Dr
- 1706 E Gaylon Dr
- 1832 S River Dr
- 2612 S Azalea Dr
- 1633 E Wesleyan Dr
- 2410 E Wesleyan Dr
- 2644 S Butte Ave
- 2134 E Broadway Rd Unit 1039
- 2012 E Cairo Dr
- 2022 E Cairo Dr
- 2015 E Balboa Dr
- 2011 E Balboa Dr
- 2019 E Balboa Dr
- 2008 E Cairo Dr
- 2026 E Cairo Dr
- 2015 E Cairo Dr
- 2007 E Balboa Dr
- 2013 E Cairo Dr
- 2023 E Balboa Dr
- 2025 E Cairo Dr
- 2011 E Cairo Dr
- 2027 E Cairo Dr
- 2030 E Cairo Dr
- 2009 E Cairo Dr
- 2004 E Cairo Dr
- 2027 E Balboa Dr
- 2029 E Cairo Dr
- 2003 E Balboa Dr
Your Personal Tour Guide
Ask me questions while you tour the home.