2016 N 23rd Place Phoenix, AZ 85006
Central City NeighborhoodEstimated Value: $270,724 - $369,000
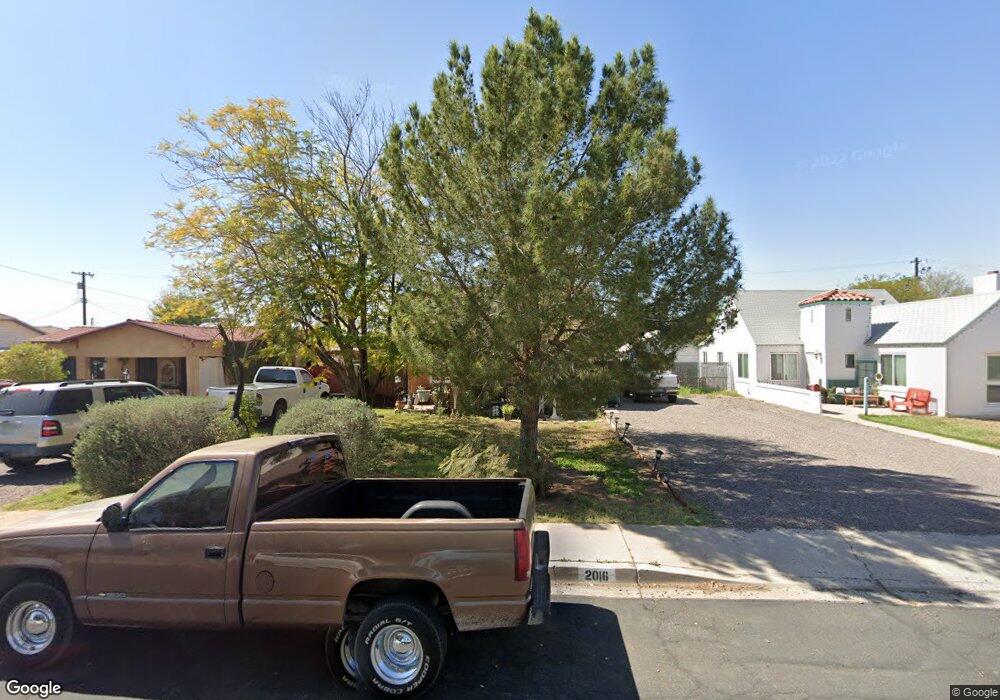
About This Home
This home is located at 2016 N 23rd Place, Phoenix, AZ 85006 and is currently estimated at $335,431, approximately $383 per square foot. 2016 N 23rd Place is a home located in Maricopa County with nearby schools including William T Machan Elementary School, Camelback High School, and Phoenix Coding Academy.
Ownership History
We collect this data history from publicly available records. To have your information removed, we recommend requesting removal directly through your county’s website.
Purchase Details
Home Financials for this Owner
Home Financials are based on the most recent Mortgage that was taken out on this home.Purchase Details
Purchase Details
Home Financials for this Owner
Home Financials are based on the most recent Mortgage that was taken out on this home.Home Values in the Area
Average Home Value in this Area
Purchase History
We collect this data history from publicly available records. To have your information removed, we recommend requesting removal directly through your county’s website.
| Date | Buyer | Sale Price | Title Company |
|---|---|---|---|
| -- | First Financial Title Agency | ||
| -- | -- | ||
| $55,000 | Chicago Title Insurance Co |
Mortgage History
We collect this data history from publicly available records. To have your information removed, we recommend requesting removal directly through your county’s website.
| Date | Status | Borrower | Loan Amount |
|---|---|---|---|
| Open | $88,500 | ||
| Closed | $50,000 |
Tax History
We collect this data history from publicly available records. To have your information removed, we recommend requesting removal directly through your county’s website.
| Year | Tax Paid | Tax Assessment Tax Assessment Total Assessment is a certain percentage of the fair market value that is determined by local assessors to be the total taxable value of land and additions on the property. | Land | Improvement |
|---|---|---|---|---|
| 2025 | $541 | $4,532 | -- | -- |
| 2024 | $514 | $4,317 | -- | -- |
| 2023 | $514 | $23,610 | $4,720 | $18,890 |
| 2022 | $492 | $18,160 | $3,630 | $14,530 |
| 2021 | $511 | $15,960 | $3,190 | $12,770 |
| 2020 | $498 | $14,530 | $2,900 | $11,630 |
| 2019 | $495 | $12,430 | $2,480 | $9,950 |
| 2018 | $484 | $11,350 | $2,270 | $9,080 |
| 2017 | $464 | $8,880 | $1,770 | $7,110 |
| 2016 | $445 | $6,850 | $1,370 | $5,480 |
| 2015 | $415 | $5,800 | $1,160 | $4,640 |
Map
- 2037 N 22nd St
- 2301 E Harvard St Unit 4
- 1643 N 22nd Place
- 2314 E Harvard St Unit 2
- 2320 E Harvard St
- 2242 E Harvard St
- 2218 N 21st Place
- 2126 N 25th Place
- 1816 N 25th Place
- 2217 E Sheridan St
- 2218 E Yale St
- 2206 E Yale St Unit 24
- 2206 E Yale St
- 2601 E Harvard St
- 1934 E Monte Vista Rd
- 2243 E Willetta St
- 2109 E Virginia Ave
- 2221 N 27th St
- 2047 E Virginia Ave
- 2601 E Virginia Ave
- 2022 N 23rd Place
- 2014 N 23rd Place
- 2024 N 23rd Place
- 2012 N 23rd Place
- 2031 N 23rd St
- 2026 N 23rd Place
- 2033 N 23rd St
- 2025 N 23rd St
- 2018 N 23rd Place
- 2037 N 23rd St
- 2021 N 23rd St
- 2029 N 23rd Place
- 2025 N 23rd Place
- 2030 N 23rd Place
- 2008 N 23rd Place
- 2021 N 23rd Place
- 2041 N 23rd St
- 2017 N 23rd St
- 2037 N 23rd Place
- 2017 N 23rd Place
Ask me questions while you tour the home.