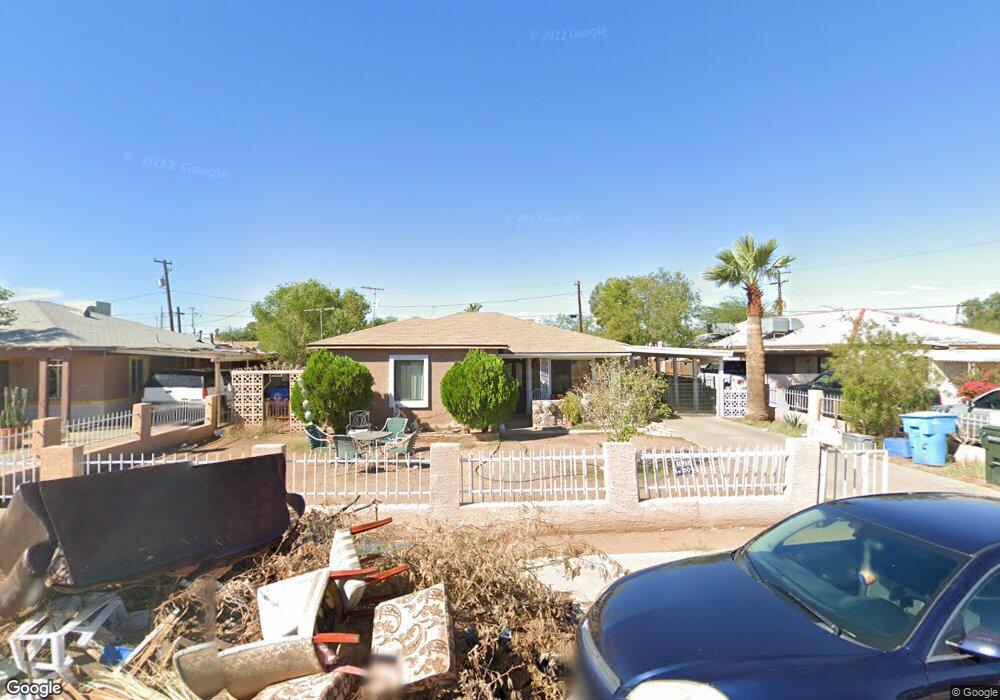
2016 N 24th Place Phoenix, AZ 85008
Central City NeighborhoodEstimated Value: $309,370 - $382,000
--
Bed
1
Bath
1,086
Sq Ft
$325/Sq Ft
Est. Value
About This Home
This home is located at 2016 N 24th Place, Phoenix, AZ 85008 and is currently estimated at $352,593, approximately $324 per square foot. 2016 N 24th Place is a home located in Maricopa County with nearby schools including The Creighton Academy, Camelback High School, and Phoenix Coding Academy.
Ownership History
Date
Name
Owned For
Owner Type
Purchase Details
Closed on
Mar 8, 2018
Sold by
Luevano Francisco and Flores Elida
Bought by
Marquez Ana Flores
Current Estimated Value
Home Financials for this Owner
Home Financials are based on the most recent Mortgage that was taken out on this home.
Original Mortgage
$70,000
Outstanding Balance
$50,678
Interest Rate
4.46%
Mortgage Type
New Conventional
Estimated Equity
$301,915
Create a Home Valuation Report for This Property
The Home Valuation Report is an in-depth analysis detailing your home's value as well as a comparison with similar homes in the area
Home Values in the Area
Average Home Value in this Area
Purchase History
| Date | Buyer | Sale Price | Title Company |
|---|---|---|---|
| Marquez Ana Flores | -- | Security Title Agency Inc |
Source: Public Records
Mortgage History
| Date | Status | Borrower | Loan Amount |
|---|---|---|---|
| Open | Marquez Ana Flores | $70,000 |
Source: Public Records
Tax History Compared to Growth
Tax History
| Year | Tax Paid | Tax Assessment Tax Assessment Total Assessment is a certain percentage of the fair market value that is determined by local assessors to be the total taxable value of land and additions on the property. | Land | Improvement |
|---|---|---|---|---|
| 2025 | $735 | $5,443 | -- | -- |
| 2024 | $699 | $5,184 | -- | -- |
| 2023 | $699 | $24,950 | $4,990 | $19,960 |
| 2022 | $672 | $18,970 | $3,790 | $15,180 |
| 2021 | $688 | $18,170 | $3,630 | $14,540 |
| 2020 | $672 | $14,270 | $2,850 | $11,420 |
| 2019 | $739 | $12,030 | $2,400 | $9,630 |
| 2018 | $581 | $10,850 | $2,170 | $8,680 |
| 2017 | $558 | $9,210 | $1,840 | $7,370 |
| 2016 | $535 | $7,600 | $1,520 | $6,080 |
| 2015 | $499 | $5,880 | $1,170 | $4,710 |
Source: Public Records
Map
Nearby Homes
- 2112 N 24th Place
- 1910 N 25th Place
- 2214 N 24th Place
- 2112 N 25th Place
- 2101 N 25th Place
- 2024 N 26th Place
- 2425 E Harvard St
- 2202 N 26th Place
- 2301 E Harvard St Unit 4
- 2230 E Oak St
- 1916 N 22nd St
- 2242 E Harvard St
- 2210 N 27th Place
- 2246 E Sheridan St
- 2301 N 27th St
- 2217 E Sheridan St
- 2215 N 21st St
- 2250 E Willetta St
- 2210 E Sheridan St Unit 16
- 2601 E Virginia Ave
- 2012 N 24th Place
- 2022 N 24th Place
- 2006 N 24th Place
- 2002 N 24th Place
- 2102 N 24th Place
- 2015 N 24th Place
- 2021 N 24th Place
- 2021 N 24th Place Unit B
- 2011 N 24th Place
- 2023 N 24th Place
- 2005 N 24th Place
- 1922 N 24th Place
- 2110 N 24th Place
- 2101 N 24th Place
- 2001 N 24th Place
- 2101 N 24th St
- 1921 N 24th Place
- 2109 N 24th Place
- 2107 N 24th St
- 1918 N 24th Place