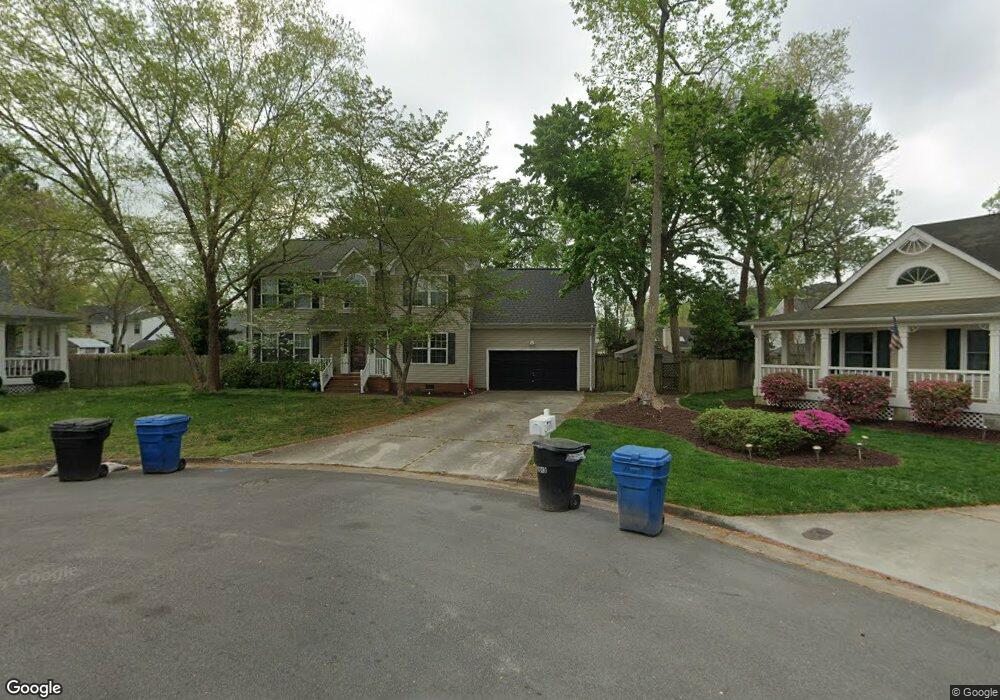
2016 Plowshares Ct Virginia Beach, VA 23453
Dam Neck NeighborhoodEstimated Value: $599,665 - $649,000
5
Beds
3
Baths
2,540
Sq Ft
$246/Sq Ft
Est. Value
About This Home
This home is located at 2016 Plowshares Ct, Virginia Beach, VA 23453 and is currently estimated at $624,916, approximately $246 per square foot. 2016 Plowshares Ct is a home located in Virginia Beach City with nearby schools including Christopher Farms Elementary School, Princess Anne Middle School, and Floyd E. Kellam High School.
Ownership History
Date
Name
Owned For
Owner Type
Purchase Details
Closed on
Dec 23, 2021
Sold by
William Dwyer Daniel
Bought by
Mize Robert Wesley and Mize Katrina Tess
Current Estimated Value
Home Financials for this Owner
Home Financials are based on the most recent Mortgage that was taken out on this home.
Original Mortgage
$548,044
Outstanding Balance
$504,124
Interest Rate
3.12%
Mortgage Type
VA
Estimated Equity
$120,792
Purchase Details
Closed on
Jun 7, 2004
Sold by
Karlstrand Jeffrey
Bought by
Curry Timothy
Home Financials for this Owner
Home Financials are based on the most recent Mortgage that was taken out on this home.
Original Mortgage
$246,800
Interest Rate
6.33%
Mortgage Type
New Conventional
Purchase Details
Closed on
Dec 8, 1998
Sold by
Mctighe Susan D
Bought by
Karlstrand Jeffrey
Home Financials for this Owner
Home Financials are based on the most recent Mortgage that was taken out on this home.
Original Mortgage
$142,000
Interest Rate
6.8%
Create a Home Valuation Report for This Property
The Home Valuation Report is an in-depth analysis detailing your home's value as well as a comparison with similar homes in the area
Home Values in the Area
Average Home Value in this Area
Purchase History
| Date | Buyer | Sale Price | Title Company |
|---|---|---|---|
| Mize Robert Wesley | $529,000 | Fidelity National Title | |
| Mize Robert Wesley | $529,000 | Fidelity National Title | |
| Curry Timothy | $315,000 | -- | |
| Karlstrand Jeffrey | $178,000 | -- |
Source: Public Records
Mortgage History
| Date | Status | Borrower | Loan Amount |
|---|---|---|---|
| Open | Mize Robert Wesley | $548,044 | |
| Closed | Mize Robert Wesley | $548,044 | |
| Previous Owner | Curry Timothy | $246,800 | |
| Previous Owner | Karlstrand Jeffrey | $142,000 |
Source: Public Records
Tax History Compared to Growth
Tax History
| Year | Tax Paid | Tax Assessment Tax Assessment Total Assessment is a certain percentage of the fair market value that is determined by local assessors to be the total taxable value of land and additions on the property. | Land | Improvement |
|---|---|---|---|---|
| 2025 | $4,852 | $523,800 | $190,000 | $333,800 |
| 2024 | $4,852 | $500,200 | $180,000 | $320,200 |
| 2023 | $4,916 | $496,600 | $180,000 | $316,600 |
| 2022 | $4,263 | $430,600 | $158,600 | $272,000 |
| 2021 | $3,765 | $380,300 | $143,600 | $236,700 |
| 2020 | $3,863 | $379,700 | $143,600 | $236,100 |
| 2019 | $3,777 | $354,700 | $143,600 | $211,100 |
| 2018 | $3,556 | $354,700 | $143,600 | $211,100 |
| 2017 | $3,556 | $354,700 | $143,600 | $211,100 |
| 2016 | $3,403 | $343,700 | $143,600 | $200,100 |
| 2015 | $3,446 | $348,100 | $143,600 | $204,500 |
| 2014 | $3,084 | $347,800 | $140,300 | $207,500 |
Source: Public Records
Map
Nearby Homes
- 2748 Christopher Farms Dr
- 2624 Rochambeau Way
- 2413 Dunning Arch
- 2812 Pleasant Acres Dr
- 1909 Maple Shade Dr
- 1713 Lapstone Ct
- 1809 Chestwood Dr
- 2308 Holland Rd
- 2921 Bluegrass Ln
- 1729 Chestwood Dr
- The Savannah Plan at Enclave at Victory
- The Harriet Plan at Enclave at Victory
- The Dimitri Plan at Enclave at Victory
- 2604 Magnolia Green Loop
- 2020 Aloma Dr
- 2604 Saint Regis Ln
- 2320 Pierce Ln
- 2946 Sugar Maple Dr
- Galiano Plan at North Landing Estates
- Grand Aruba Plan at North Landing Estates
- 2648 Cantwell Rd
- 2013 Plowshares Ct
- 2012 Plowshares Ct
- 2652 Cantwell Rd
- 2644 Cantwell Rd
- 2009 Plowshares Ct
- 2008 Plowshares Ct
- 2008 Plowshares Ct Unit Court
- 2656 Cantwell Rd
- 2640 Cantwell Rd
- 2009 Split Rail Dr
- 2012 Hen House Dr
- 2005 Plowshares Ct
- 2008 Split Rail Dr
- 2660 Cantwell Rd
- 2016 Hen House Dr
- 2409 Strawflower Ct
- 2636 Cantwell Rd
- 2008 Hen House Dr
- 2004 Hen House Dr