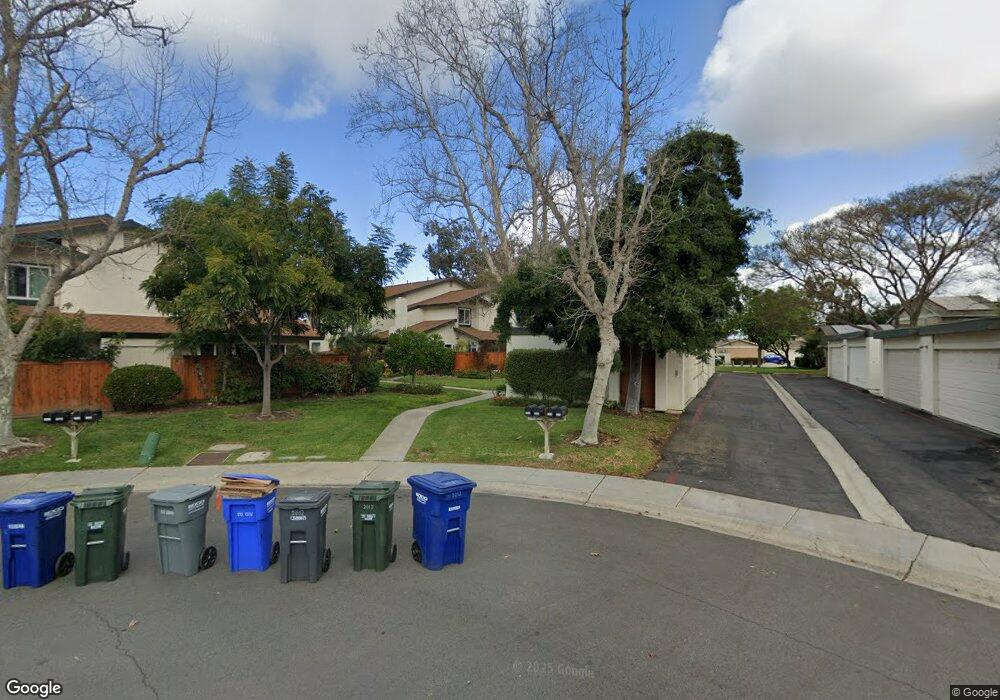
2016 Shadytree Ln Unit 383 Encinitas, CA 92024
Central Encinitas NeighborhoodEstimated Value: $1,030,000 - $1,288,000
3
Beds
2
Baths
1,485
Sq Ft
$769/Sq Ft
Est. Value
About This Home
This home is located at 2016 Shadytree Ln Unit 383, Encinitas, CA 92024 and is currently estimated at $1,142,518, approximately $769 per square foot. 2016 Shadytree Ln Unit 383 is a home located in San Diego County with nearby schools including Park Dale Lane Elementary, Diegueno Middle School, and La Costa Canyon High School.
Ownership History
Date
Name
Owned For
Owner Type
Purchase Details
Closed on
Jan 6, 2021
Sold by
Rodgers David M and Rodgers Teresa A
Bought by
Rodgers David M and Rodgers Teresa A
Current Estimated Value
Purchase Details
Closed on
Nov 28, 2007
Sold by
Nyberg Anders G
Bought by
Rodgers David M and Rodgers Teresa A
Home Financials for this Owner
Home Financials are based on the most recent Mortgage that was taken out on this home.
Original Mortgage
$375,200
Outstanding Balance
$236,255
Interest Rate
6.2%
Mortgage Type
Purchase Money Mortgage
Estimated Equity
$906,263
Purchase Details
Closed on
Jan 14, 2004
Sold by
Nyberg Jennifer J
Bought by
Nyberg Anders G
Home Financials for this Owner
Home Financials are based on the most recent Mortgage that was taken out on this home.
Original Mortgage
$288,000
Interest Rate
5.61%
Mortgage Type
Stand Alone Refi Refinance Of Original Loan
Purchase Details
Closed on
Aug 21, 2002
Sold by
Clark James P
Bought by
Nyberg Anders G and Nyberg Jennifer J
Home Financials for this Owner
Home Financials are based on the most recent Mortgage that was taken out on this home.
Original Mortgage
$246,400
Interest Rate
6.22%
Mortgage Type
Balloon
Purchase Details
Closed on
Jan 23, 2001
Sold by
Clark James P and Clark Patrick James
Bought by
Clark James P
Home Financials for this Owner
Home Financials are based on the most recent Mortgage that was taken out on this home.
Original Mortgage
$180,000
Interest Rate
7.13%
Mortgage Type
Purchase Money Mortgage
Purchase Details
Closed on
Dec 4, 2000
Sold by
Clark Kathleen Dale
Bought by
Clark James Patrick
Home Financials for this Owner
Home Financials are based on the most recent Mortgage that was taken out on this home.
Original Mortgage
$180,000
Interest Rate
7.13%
Mortgage Type
Purchase Money Mortgage
Purchase Details
Closed on
Jul 16, 1999
Sold by
Clark James P
Bought by
Clark Kathleen D and Clark James Patrick
Purchase Details
Closed on
Nov 4, 1998
Sold by
Clark James P and Clark Kathleen D
Bought by
Clark James Patrick
Home Financials for this Owner
Home Financials are based on the most recent Mortgage that was taken out on this home.
Original Mortgage
$144,000
Interest Rate
9.15%
Mortgage Type
Purchase Money Mortgage
Purchase Details
Closed on
Mar 10, 1992
Purchase Details
Closed on
Jul 13, 1990
Purchase Details
Closed on
Oct 29, 1985
Create a Home Valuation Report for This Property
The Home Valuation Report is an in-depth analysis detailing your home's value as well as a comparison with similar homes in the area
Home Values in the Area
Average Home Value in this Area
Purchase History
| Date | Buyer | Sale Price | Title Company |
|---|---|---|---|
| Rodgers David M | -- | None Available | |
| Rodgers David M | $469,000 | Equity Title Co San Diego | |
| Nyberg Anders G | -- | Fidelity National Title Co | |
| Nyberg Anders G | $308,000 | Southland Title | |
| Clark James P | -- | Gateway Title Company | |
| Clark James Patrick | -- | -- | |
| Clark Kathleen D | -- | -- | |
| Clark James Patrick | -- | California Title Company | |
| -- | $157,000 | -- | |
| -- | $115,000 | -- | |
| -- | $105,000 | -- |
Source: Public Records
Mortgage History
| Date | Status | Borrower | Loan Amount |
|---|---|---|---|
| Open | Rodgers David M | $375,200 | |
| Previous Owner | Nyberg Anders G | $288,000 | |
| Previous Owner | Nyberg Anders G | $246,400 | |
| Previous Owner | Clark James P | $180,000 | |
| Previous Owner | Clark James Patrick | $144,000 | |
| Closed | Nyberg Anders G | $46,200 |
Source: Public Records
Tax History
| Year | Tax Paid | Tax Assessment Tax Assessment Total Assessment is a certain percentage of the fair market value that is determined by local assessors to be the total taxable value of land and additions on the property. | Land | Improvement |
|---|---|---|---|---|
| 2025 | $6,964 | $616,016 | $471,538 | $144,478 |
| 2024 | $6,964 | $603,939 | $462,293 | $141,646 |
| 2023 | $6,757 | $592,098 | $453,229 | $138,869 |
| 2022 | $6,590 | $580,490 | $444,343 | $136,147 |
| 2021 | $6,473 | $569,109 | $435,631 | $133,478 |
| 2020 | $6,363 | $563,275 | $431,165 | $132,110 |
| 2019 | $6,237 | $552,231 | $422,711 | $129,520 |
| 2018 | $6,129 | $541,404 | $414,423 | $126,981 |
| 2017 | $6,024 | $530,790 | $406,298 | $124,492 |
| 2016 | $5,841 | $520,383 | $398,332 | $122,051 |
| 2015 | $5,287 | $470,000 | $358,000 | $112,000 |
| 2014 | $4,314 | $380,000 | $290,000 | $90,000 |
Source: Public Records
Map
Nearby Homes
- 324 Countrywood Ln
- 1824 Eastwood Ln
- 1830 Gatepost Rd
- 2037 Countrywood Way
- 1971 Azure Way
- 1986 Azure Way Unit 107
- 516 Whisper Wind Dr
- 1741 Charleston Ln
- 905 Olive Crest Dr
- 1105 Catania Ct Unit 201
- 804 & 814 Clark Ave
- 3736 38 Via Rancho Michelle
- 200 202 Neptune Ave
- 772 Conestoga Ct
- 250 258 Hillcrest Dr
- 1709 Edgefield Ln
- 1733 Gentle Breeze Ln
- 1825 Hummock Ln
- 1926 Springdale Ln
- 1617 Blossom Field Way
- 2038 Shadytree Ln Unit 394
- 2032 Shadytree Ln
- 2030 Shadytree Ln
- 2022 Shadytree Ln Unit 386
- 2020 Shadytree Ln
- 2010 Shadytree Ln
- 2014 Shadytree Ln
- 2039 Shadytree Ln
- 2021 Shadytree Ln
- 2023 Shadytree Ln
- 2031 Shadytree Ln
- 2033 Shadytree Ln
- 2037 Shadytree Ln
- 2025 Shadytree Ln
- 2019 Shadytree Ln
- 2015 Shadytree Ln
- 2029 Shadytree Ln
- 2027 Shadytree Ln
- 2017 Shadytree Ln
- 2011 Shadytree Ln
Your Personal Tour Guide
Ask me questions while you tour the home.