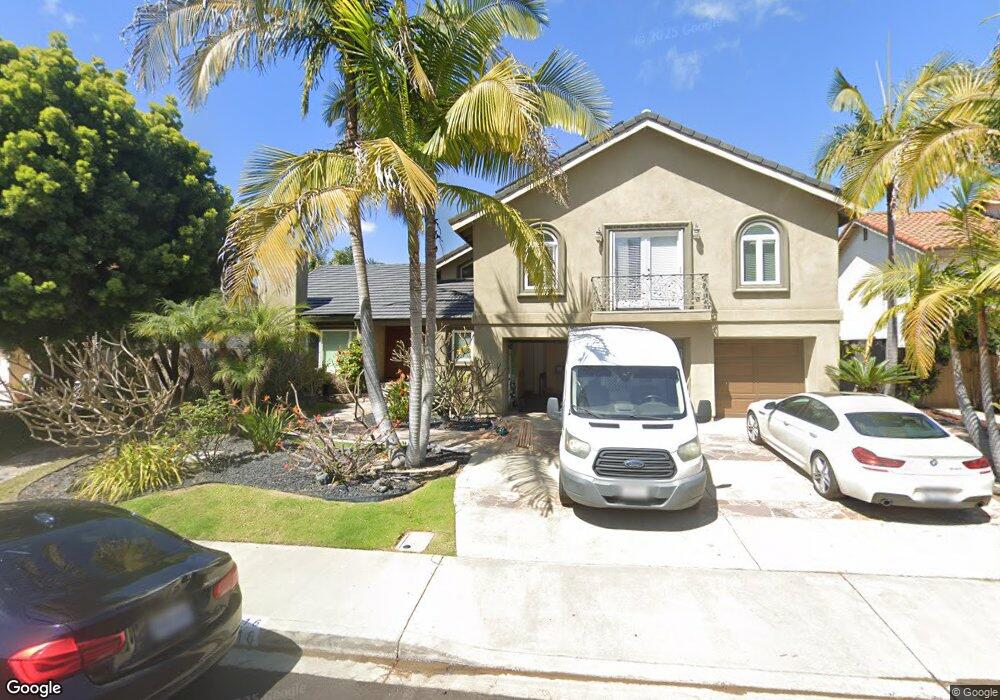
2016 Subida Terrace Carlsbad, CA 92009
La Costa NeighborhoodEstimated Value: $1,985,000 - $2,343,000
4
Beds
4
Baths
2,937
Sq Ft
$744/Sq Ft
Est. Value
About This Home
This home is located at 2016 Subida Terrace, Carlsbad, CA 92009 and is currently estimated at $2,183,738, approximately $743 per square foot. 2016 Subida Terrace is a home located in San Diego County with nearby schools including La Costa Heights Elementary School, Oak Crest Middle School, and La Costa Canyon High School.
Ownership History
Date
Name
Owned For
Owner Type
Purchase Details
Closed on
Mar 17, 2003
Sold by
Ahranjani Massiheddin and Ahranjani Susanna M
Bought by
Ahranjani Massiheddin and Ahranjani Susanna M
Current Estimated Value
Purchase Details
Closed on
Jun 15, 2001
Sold by
Ahranjani Massih
Bought by
Ahranjani Massih and Ahranjani Susanna
Home Financials for this Owner
Home Financials are based on the most recent Mortgage that was taken out on this home.
Original Mortgage
$258,000
Interest Rate
6.65%
Purchase Details
Closed on
Jun 14, 1995
Sold by
Levitz Sam R and Levitz Valerie
Bought by
Ahranjani Massih
Home Financials for this Owner
Home Financials are based on the most recent Mortgage that was taken out on this home.
Original Mortgage
$277,600
Interest Rate
7.62%
Purchase Details
Closed on
Oct 27, 1986
Create a Home Valuation Report for This Property
The Home Valuation Report is an in-depth analysis detailing your home's value as well as a comparison with similar homes in the area
Home Values in the Area
Average Home Value in this Area
Purchase History
| Date | Buyer | Sale Price | Title Company |
|---|---|---|---|
| Ahranjani Massiheddin | -- | -- | |
| Ahranjani Massih | -- | American Title Ins Co | |
| Ahranjani Massih | $347,000 | Guardian Title Company | |
| Ahranjani Massih | -- | Guardian Title Company | |
| -- | $235,000 | -- |
Source: Public Records
Mortgage History
| Date | Status | Borrower | Loan Amount |
|---|---|---|---|
| Closed | Ahranjani Massih | $258,000 | |
| Previous Owner | Ahranjani Massih | $277,600 |
Source: Public Records
Tax History
| Year | Tax Paid | Tax Assessment Tax Assessment Total Assessment is a certain percentage of the fair market value that is determined by local assessors to be the total taxable value of land and additions on the property. | Land | Improvement |
|---|---|---|---|---|
| 2025 | $6,854 | $597,446 | $227,809 | $369,637 |
| 2024 | $6,854 | $585,733 | $223,343 | $362,390 |
| 2023 | $6,652 | $574,249 | $218,964 | $355,285 |
| 2022 | $6,491 | $562,990 | $214,671 | $348,319 |
| 2021 | $6,378 | $551,952 | $210,462 | $341,490 |
| 2020 | $6,271 | $546,293 | $208,304 | $337,989 |
| 2019 | $6,150 | $535,582 | $204,220 | $331,362 |
| 2018 | $6,050 | $525,081 | $200,216 | $324,865 |
| 2017 | $5,948 | $514,787 | $196,291 | $318,496 |
| 2016 | $5,770 | $504,694 | $192,443 | $312,251 |
| 2015 | $5,591 | $497,114 | $189,553 | $307,561 |
| 2014 | $5,458 | $487,377 | $185,840 | $301,537 |
Source: Public Records
Map
Nearby Homes
- 2124 Pintoresco Ct
- 7627 Reposado Dr
- 2002 Ladera Ct
- 2415 La Costa Ave Unit C
- 2403 La Costa Ave Unit A
- 2348 La Costa Ave Unit 202
- 2297 Levante St
- 2204 Recodo Ct
- 2003 Costa Del Mar Rd Unit 692
- 2005 Costa Del Mar Rd Unit 630
- 2005 Costa Del Mar Rd Unit 636
- 7767 Caminito Monarca Unit 100
- 7758 Caminito Monarca Unit 101
- 7768 Caminito Monarca Unit 109
- 7319 Estrella de Mar Rd
- 7323 Estrella de Mar Rd Unit 41
- 27 Greenview Dr
- 2712 Mateo Place
- 2606 Galicia Way
- 2524 La Costa Ave
- 2018 Subida Terrace
- 2014 Subida Terrace
- 2020 Subida Terrace
- 2012 Subida Terrace
- 2016 Saliente Way
- 2018 Saliente Way
- 2014 Saliente Way
- 2104 Saliente Way
- 2120 Saliente Way
- 2122 Subida Terrace
- 2122 Saliente Way
- 2012 Saliente Way
- 2124 Saliente Way
- 2008 Subida Terrace
- 2124 Subida Terrace
- 2126 Saliente Way
- 2018 Pintoresco Ct
- 2016 Pintoresco Ct
- 2006 Saliente Way
- 2006 Subida Terrace
Your Personal Tour Guide
Ask me questions while you tour the home.