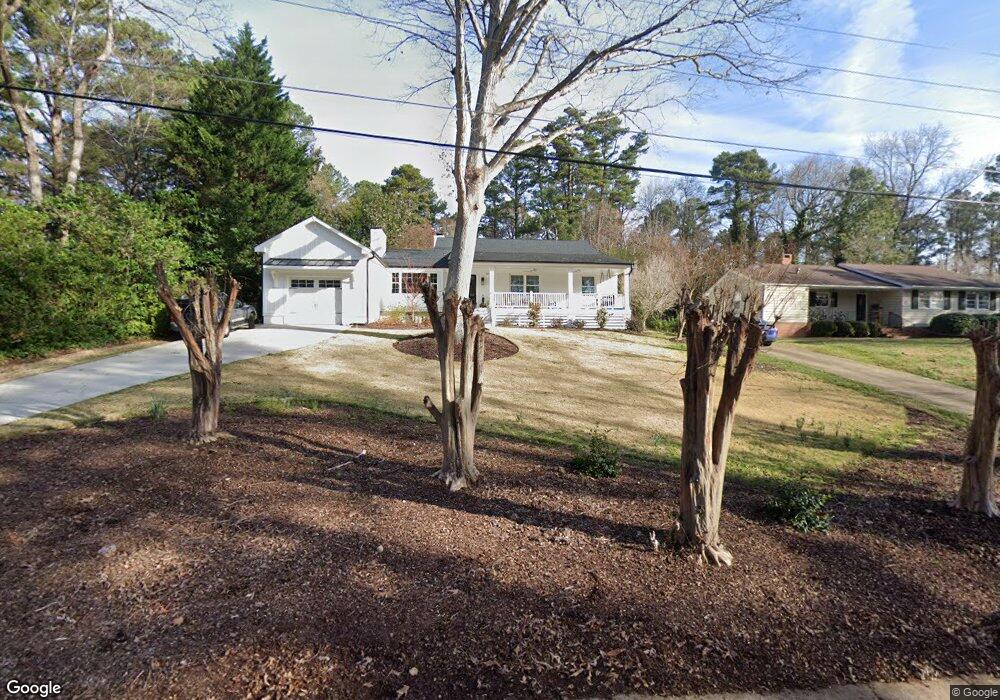
2016 Varnell Ave Raleigh, NC 27612
Inner Beltline West NeighborhoodEstimated Value: $866,000 - $960,357
Studio
2
Baths
2,430
Sq Ft
$375/Sq Ft
Est. Value
About This Home
This home is located at 2016 Varnell Ave, Raleigh, NC 27612 and is currently estimated at $911,339, approximately $375 per square foot. 2016 Varnell Ave is a home located in Wake County with nearby schools including Lacy Elementary, Oberlin Middle School, and Broughton Magnet High School.
Ownership History
Date
Name
Owned For
Owner Type
Purchase Details
Closed on
Oct 7, 2025
Sold by
Taylor Elizabeth Ann and Cremer Jordan Lowell
Bought by
Jordan And Elizabeth Cremer Living Trust and Cremer
Current Estimated Value
Purchase Details
Closed on
Sep 28, 2022
Sold by
Davis William J and Davis Carolyn R
Bought by
Cremer Jordan Lowell and Taylor Elizabeth Ann
Home Financials for this Owner
Home Financials are based on the most recent Mortgage that was taken out on this home.
Original Mortgage
$720,000
Interest Rate
4.38%
Mortgage Type
New Conventional
Purchase Details
Closed on
Sep 27, 2017
Sold by
Easter Gretel Zweigart and Easter David W
Bought by
Davis William J and Davis Carolyn P
Home Financials for this Owner
Home Financials are based on the most recent Mortgage that was taken out on this home.
Original Mortgage
$260,000
Interest Rate
3.87%
Mortgage Type
Adjustable Rate Mortgage/ARM
Purchase Details
Closed on
Aug 24, 1987
Bought by
Easter Gretel Zweigart
Create a Home Valuation Report for This Property
The Home Valuation Report is an in-depth analysis detailing your home's value as well as a comparison with similar homes in the area
Home Values in the Area
Average Home Value in this Area
Purchase History
| Date | Buyer | Sale Price | Title Company |
|---|---|---|---|
| Jordan And Elizabeth Cremer Living Trust | -- | None Listed On Document | |
| Cremer Jordan Lowell | $900,000 | -- | |
| Davis William J | $325,000 | None Available | |
| Easter Gretel Zweigart | $100,000 | -- |
Source: Public Records
Mortgage History
| Date | Status | Borrower | Loan Amount |
|---|---|---|---|
| Previous Owner | Cremer Jordan Lowell | $720,000 | |
| Previous Owner | Davis William J | $260,000 |
Source: Public Records
Tax History
| Year | Tax Paid | Tax Assessment Tax Assessment Total Assessment is a certain percentage of the fair market value that is determined by local assessors to be the total taxable value of land and additions on the property. | Land | Improvement |
|---|---|---|---|---|
| 2025 | $7,829 | $895,470 | $420,000 | $475,470 |
| 2024 | $7,797 | $895,470 | $420,000 | $475,470 |
| 2023 | $6,476 | $592,250 | $270,000 | $322,250 |
| 2022 | $6,017 | $592,250 | $270,000 | $322,250 |
| 2021 | $5,783 | $592,250 | $270,000 | $322,250 |
| 2020 | $5,677 | $592,250 | $270,000 | $322,250 |
| 2019 | $4,983 | $428,276 | $153,000 | $275,276 |
| 2018 | $3,068 | $278,962 | $153,000 | $125,962 |
| 2017 | $2,922 | $278,962 | $153,000 | $125,962 |
| 2016 | $2,862 | $278,962 | $153,000 | $125,962 |
| 2015 | $2,715 | $260,255 | $143,000 | $117,255 |
| 2014 | $2,575 | $260,255 | $143,000 | $117,255 |
Source: Public Records
Map
Nearby Homes
- 3004 Ridge Rd
- 3601 Swann St
- 3702 Nova Star Ln
- 1201 Bancroft St
- 3918 Milltown Ridge Run
- 1404 Westmoreland Dr
- 4300 Edgehill Ct
- 2120 Hillock Dr
- 3620 Alamance Dr
- 2009 Philcrest Rd
- 2416 Ridge Rd
- 3619 Alleghany Dr
- 2425 Wentworth St
- 2400 Rockridge Ct
- 1900 Small Ct
- 2309 Wheeler Rd
- 4505 Wenchelsea Place
- 4012 Arckelton Dr
- 4105 Arckelton Dr
- 1009 Westwood Dr
- 2100 Varnell Ave
- 2012 Varnell Ave
- 2008 Varnell Ave
- 3716 Corbin St
- 3713 Corbin St
- 2004 Varnell Ave
- 2007 Varnell Ave
- 3016 Ridge Rd
- 3016 10th Ave
- 3712 Corbin St
- 3717 Swann St
- 2000 Varnell Ave
- 3709 Swann St
- 3705 Swann St
- 3012 Ridge Rd
- 3706 Corbin St
- 3705 Corbin St
- 3012 10th Ave
- 1908 Varnell Ave
- 3008 Ridge Rd
Your Personal Tour Guide
Ask me questions while you tour the home.