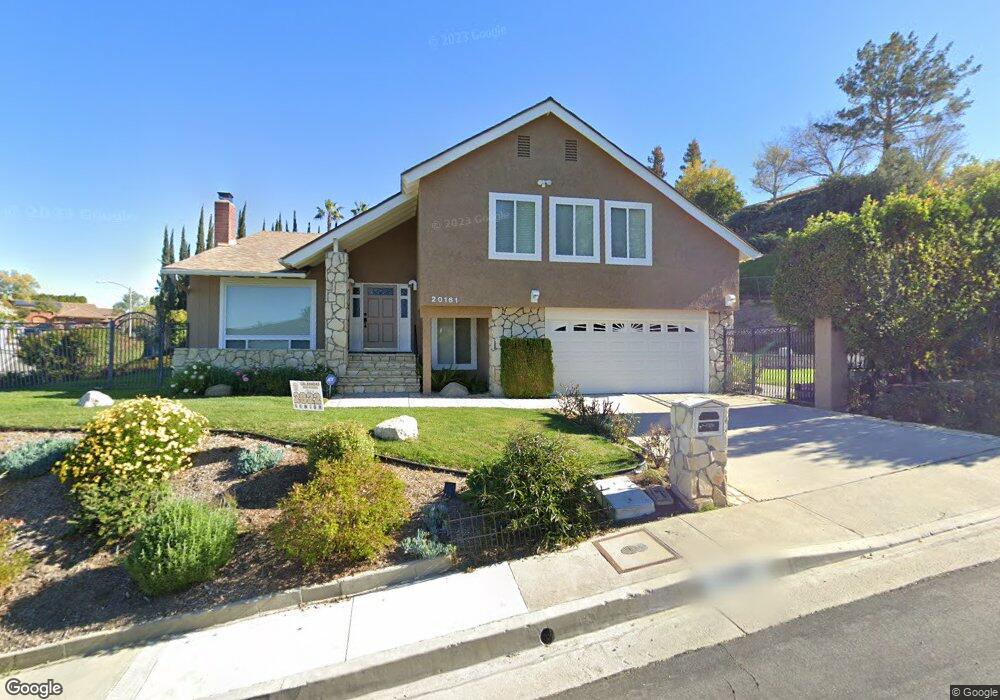
20161 Ruston Rd Woodland Hills, CA 91364
Estimated Value: $1,829,589 - $2,011,000
5
Beds
3
Baths
2,574
Sq Ft
$746/Sq Ft
Est. Value
About This Home
This home is located at 20161 Ruston Rd, Woodland Hills, CA 91364 and is currently estimated at $1,920,647, approximately $746 per square foot. 20161 Ruston Rd is a home located in Los Angeles County with nearby schools including Woodland Hills Academy, Serrania Charter For Enriched Studies, and CHIME Institute's Schwarzenegger Community.
Ownership History
Date
Name
Owned For
Owner Type
Purchase Details
Closed on
Oct 8, 2014
Sold by
Gustafson Stephen P and Gustafson Kim D
Bought by
Gustafson Stephen P and Gustafson Kim D
Current Estimated Value
Home Financials for this Owner
Home Financials are based on the most recent Mortgage that was taken out on this home.
Original Mortgage
$516,300
Outstanding Balance
$395,819
Interest Rate
4.1%
Mortgage Type
New Conventional
Estimated Equity
$1,524,828
Purchase Details
Closed on
Jul 31, 2003
Sold by
Johnson Robbie and Johnson Mary
Bought by
Gustafson Stephen P and Gustafson Kim D
Home Financials for this Owner
Home Financials are based on the most recent Mortgage that was taken out on this home.
Original Mortgage
$648,800
Interest Rate
4.75%
Mortgage Type
New Conventional
Purchase Details
Closed on
Feb 23, 1997
Sold by
Moldavon Martin and Moldavon Ilona
Bought by
Johnson Robbie and Johnson Mary
Create a Home Valuation Report for This Property
The Home Valuation Report is an in-depth analysis detailing your home's value as well as a comparison with similar homes in the area
Home Values in the Area
Average Home Value in this Area
Purchase History
| Date | Buyer | Sale Price | Title Company |
|---|---|---|---|
| Gustafson Stephen P | -- | None Available | |
| Gustafson Stephen P | $811,000 | Ticor Title Company | |
| Johnson Robbie | $390,000 | California Counties Title Co |
Source: Public Records
Mortgage History
| Date | Status | Borrower | Loan Amount |
|---|---|---|---|
| Open | Gustafson Stephen P | $516,300 | |
| Closed | Gustafson Stephen P | $648,800 |
Source: Public Records
Tax History Compared to Growth
Tax History
| Year | Tax Paid | Tax Assessment Tax Assessment Total Assessment is a certain percentage of the fair market value that is determined by local assessors to be the total taxable value of land and additions on the property. | Land | Improvement |
|---|---|---|---|---|
| 2025 | $14,125 | $1,153,055 | $727,948 | $425,107 |
| 2024 | $14,125 | $1,130,447 | $713,675 | $416,772 |
| 2023 | $13,856 | $1,108,282 | $699,682 | $408,600 |
| 2022 | $13,241 | $1,086,552 | $685,963 | $400,589 |
| 2021 | $13,076 | $1,065,248 | $672,513 | $392,735 |
| 2019 | $12,691 | $1,033,654 | $652,567 | $381,087 |
| 2018 | $12,532 | $1,013,387 | $639,772 | $373,615 |
| 2016 | $11,963 | $974,038 | $614,930 | $359,108 |
| 2015 | $11,790 | $959,408 | $605,694 | $353,714 |
| 2014 | $11,831 | $940,616 | $593,830 | $346,786 |
Source: Public Records
Map
Nearby Homes
- 4424 Deanwood Dr
- 4400 Chaumont Rd
- 20315 Howard Ct
- 4658 Del Moreno Dr
- 4430 Natoma Ave
- 4532 Del Moreno Dr
- 4555 Winnetka Ave
- 20193 Adele Dr
- 20608 Chatsboro Dr
- 4707 Nomad Dr
- 4608 Westchester Dr
- 20620 Chatsboro Dr
- 4256 Tarzana Estates Dr
- 4885 Winnetka Ave
- 20351 Alerion Place
- 19714 Komar Dr
- 19715 Komar Dr
- 4751 Westchester Dr
- 20225 Allentown Dr
- 4854 Nomad Dr
- 4514 Tenango Dr
- 20151 Phaeton Dr
- 20145 Ruston Rd
- 20168 Ruston Rd
- 20201 Ruston Rd
- 20156 Ruston Rd
- 20200 Ruston Rd
- 20139 Phaeton Dr
- 4526 Tenango Dr
- 20144 Ruston Rd
- 4525 Tenango Dr
- 4458 Deanwood Dr
- 20215 Ruston Rd
- 4466 Deanwood Dr
- 20212 Ruston Rd
- 4446 Deanwood Dr
- 20150 Phaeton Dr
- 20131 Phaeton Dr
- 20129 Ruston Rd
- 20160 Phaeton Dr