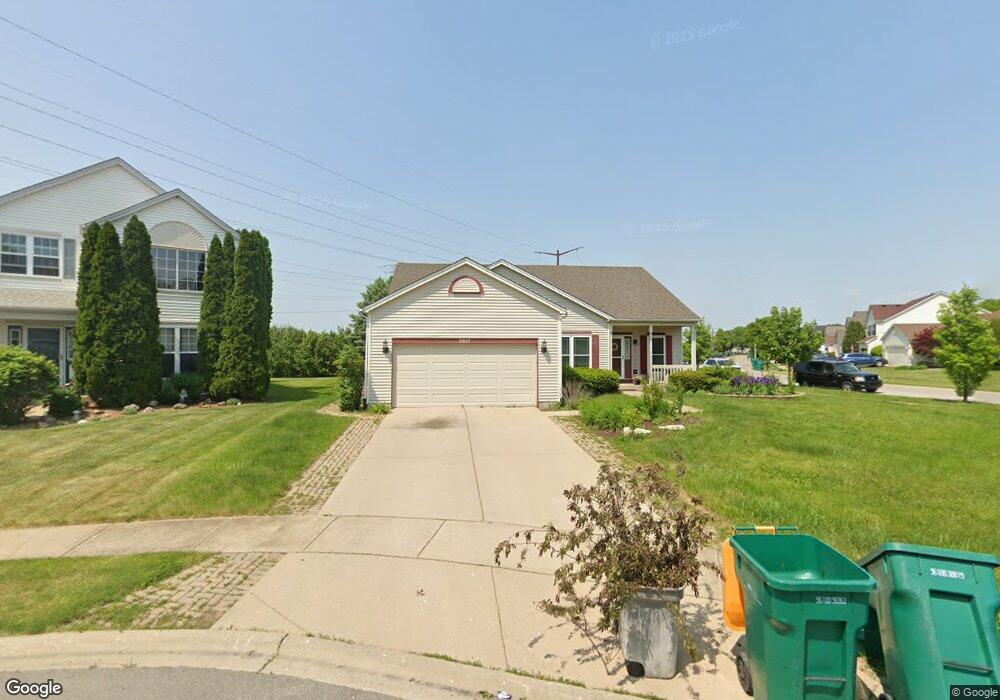
2017 Briar Ridge Ct Plainfield, IL 60586
Fall Creek NeighborhoodEstimated Value: $375,000 - $386,000
5
Beds
3
Baths
1,850
Sq Ft
$207/Sq Ft
Est. Value
About This Home
This home is located at 2017 Briar Ridge Ct, Plainfield, IL 60586 and is currently estimated at $382,158, approximately $206 per square foot. 2017 Briar Ridge Ct is a home located in Will County with nearby schools including Wesmere Elementary School, Drauden Point Middle School, and Plainfield South High School.
Ownership History
Date
Name
Owned For
Owner Type
Purchase Details
Closed on
Dec 13, 2017
Sold by
Alberts John M and Alberts Kelly A
Bought by
James Nancy Louise and Guegel Genevieve
Current Estimated Value
Purchase Details
Closed on
Oct 14, 2010
Sold by
Alberts Kelly A and Alberts John M
Bought by
Alberts Kelly A and Alberts John M
Home Financials for this Owner
Home Financials are based on the most recent Mortgage that was taken out on this home.
Original Mortgage
$150,000
Interest Rate
4.65%
Mortgage Type
New Conventional
Purchase Details
Closed on
Apr 9, 2000
Sold by
Neumann Homes Inc
Bought by
Alberts John M and Alberts Kelly A
Home Financials for this Owner
Home Financials are based on the most recent Mortgage that was taken out on this home.
Original Mortgage
$182,464
Interest Rate
8.56%
Mortgage Type
VA
Create a Home Valuation Report for This Property
The Home Valuation Report is an in-depth analysis detailing your home's value as well as a comparison with similar homes in the area
Home Values in the Area
Average Home Value in this Area
Purchase History
| Date | Buyer | Sale Price | Title Company |
|---|---|---|---|
| James Nancy Louise | $250,000 | Stewart Title | |
| Alberts Kelly A | -- | First American Title | |
| Alberts John M | $177,500 | Chicago Title Insurance Co |
Source: Public Records
Mortgage History
| Date | Status | Borrower | Loan Amount |
|---|---|---|---|
| Previous Owner | Alberts Kelly A | $150,000 | |
| Previous Owner | Alberts John M | $182,464 |
Source: Public Records
Tax History Compared to Growth
Tax History
| Year | Tax Paid | Tax Assessment Tax Assessment Total Assessment is a certain percentage of the fair market value that is determined by local assessors to be the total taxable value of land and additions on the property. | Land | Improvement |
|---|---|---|---|---|
| 2024 | $7,329 | $110,062 | $22,816 | $87,246 |
| 2023 | $7,329 | $99,406 | $20,607 | $78,799 |
| 2022 | $6,540 | $89,280 | $18,508 | $70,772 |
| 2021 | $6,198 | $83,439 | $17,297 | $66,142 |
| 2020 | $6,103 | $81,071 | $16,806 | $64,265 |
| 2019 | $5,888 | $77,247 | $16,013 | $61,234 |
| 2018 | $5,633 | $72,578 | $15,045 | $57,533 |
| 2017 | $5,462 | $68,971 | $14,297 | $54,674 |
| 2016 | $5,349 | $65,781 | $13,636 | $52,145 |
| 2015 | $4,985 | $61,622 | $12,774 | $48,848 |
| 2014 | $4,985 | $59,446 | $12,323 | $47,123 |
| 2013 | $4,985 | $59,446 | $12,323 | $47,123 |
Source: Public Records
Map
Nearby Homes
- 1605 Heritage Pointe Ct
- 0 Theodore St
- 1910 Arbor Fields Dr
- 2045 Winding Lakes Dr
- 1891 Westmore Grove Dr
- 2115 Stafford Ct Unit 3
- 1615 Caton Ridge Dr
- 1514 Spring Oaks Dr
- 1905 Chestnut Grove Dr Unit 1
- 1407 Prairie Creek Trail
- 6113 Oldcreek Ln
- 1314 Martin Ct Unit 2
- 2015 Brunswick Dr
- 1504 Lasser Dr
- 1603 Valley Ridge Dr
- 2108 Brookshire Estates Ct Unit 1
- 6304 Southridge Dr
- 5302 Meadowbrook St
- 5307 Brindlewood Dr
- 1418 Fitzer Dr
- 2015 Briar Ridge Ct
- 2019 Ridge Moor Dr
- 2013 Briar Ridge Ct
- 2022 Ridge Moor Dr Unit 4
- 2021 Ridge Moor Dr
- 2006 Ridge Moor Dr
- 2005 Briar Ridge Ct Unit 4
- 2004 Ridge Moor Dr
- 2023 Ridge Moor Dr Unit 4
- 2024 Ridge Moor Dr
- 2011 Briar Ridge Ct
- 2007 Briar Ridge Ct Unit 4
- 2009 Briar Ridge Ct
- 2002 Ridge Moor Dr
- 2025 Ridge Moor Dr
- 2026 Ridge Moor Dr
- 1915 Long Ridge Ct Unit 4
- 2003 Ridge Moor Dr
- 1913 Long Ridge Ct
- 2000 Ridge Moor Dr