2017 Button Place Redding, CA 96002
Starview NeighborhoodEstimated Value: $441,010 - $460,000
4
Beds
2
Baths
1,892
Sq Ft
$238/Sq Ft
Est. Value
About This Home
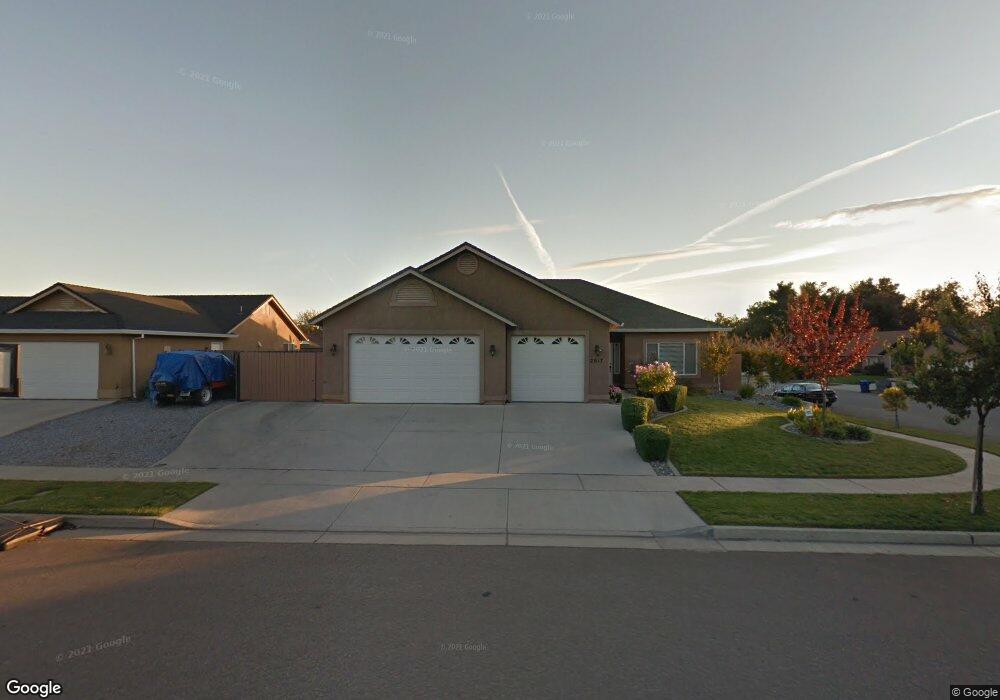
This home is located at 2017 Button Place, Redding, CA 96002 and is currently estimated at $450,753, approximately $238 per square foot. 2017 Button Place is a home located in Shasta County with nearby schools including Alta Mesa Elementary School, Parsons Junior High School, and Enterprise High School.
Ownership History
Date
Name
Owned For
Owner Type
Purchase Details
Closed on
Dec 18, 2024
Sold by
Brugaletta Joseph and Brugaletta Francesca
Bought by
Joseph Brugaletta Jr And Francesca Brugaletta and Brugaletta
Current Estimated Value
Purchase Details
Closed on
Sep 24, 2010
Sold by
Aurora Loan Services Llc
Bought by
Brugaletta Joseph and Brugaletta Francesca
Purchase Details
Closed on
Aug 25, 2010
Sold by
Davis Monnie S and Davis Christy L
Bought by
Aurora Loan Services Llc
Purchase Details
Closed on
Jul 11, 2005
Sold by
Corpac Development Inc
Bought by
Davis Monnie S and Davis Christy L
Home Financials for this Owner
Home Financials are based on the most recent Mortgage that was taken out on this home.
Original Mortgage
$273,600
Interest Rate
5.55%
Mortgage Type
Fannie Mae Freddie Mac
Create a Home Valuation Report for This Property
The Home Valuation Report is an in-depth analysis detailing your home's value as well as a comparison with similar homes in the area
Home Values in the Area
Average Home Value in this Area
Purchase History
| Date | Buyer | Sale Price | Title Company |
|---|---|---|---|
| Joseph Brugaletta Jr And Francesca Brugaletta | -- | None Listed On Document | |
| Brugaletta Joseph | -- | None Listed On Document | |
| Brugaletta Joseph | $219,000 | Fidelity Natl Title Co Of Ca | |
| Aurora Loan Services Llc | $308,568 | Accommodation | |
| Davis Monnie S | $342,500 | Placer Title Company |
Source: Public Records
Mortgage History
| Date | Status | Borrower | Loan Amount |
|---|---|---|---|
| Previous Owner | Davis Monnie S | $273,600 |
Source: Public Records
Tax History
| Year | Tax Paid | Tax Assessment Tax Assessment Total Assessment is a certain percentage of the fair market value that is determined by local assessors to be the total taxable value of land and additions on the property. | Land | Improvement |
|---|---|---|---|---|
| 2025 | $3,250 | $280,565 | $64,052 | $216,513 |
| 2024 | $3,202 | $275,065 | $62,797 | $212,268 |
| 2023 | $3,202 | $269,672 | $61,566 | $208,106 |
| 2022 | $3,104 | $264,385 | $60,359 | $204,026 |
| 2021 | $2,989 | $259,202 | $59,176 | $200,026 |
| 2020 | $2,956 | $256,545 | $58,570 | $197,975 |
| 2019 | $2,893 | $251,516 | $57,422 | $194,094 |
| 2018 | $2,833 | $246,586 | $56,297 | $190,289 |
| 2017 | $2,799 | $241,752 | $55,194 | $186,558 |
| 2016 | $2,694 | $237,012 | $54,112 | $182,900 |
| 2015 | $2,607 | $233,453 | $53,300 | $180,153 |
| 2014 | $2,541 | $228,881 | $52,256 | $176,625 |
Source: Public Records
Map
Nearby Homes
- 3341 Timbercreek Dr
- 2068 Solar Way
- 3425 Silverwood St
- 3466 Silverwood St
- 3528 Silverwood St
- 3594 Laramie St
- 3732 Mercury Dr
- 3072 Alta Mesa Dr
- 2332 Venus Way
- 1827 Bembow Dr
- 2976 West Way
- 3778 Scorpius Way
- 3688 Polaris Way
- 0 Shasta View Unit 25-1945
- 3293 Middleton Ln
- 3512 Capricorn Way
- 3283 Middleton Ln
- 3985 Cirrus St
- 4001 Alta Mesa Dr
- 2728 Jasmine Way
- 2017 Button Place Lot#19
- 2057 Button Place
- 3431 Mearn Ct
- 2097 Button Place
- 3418 Mearn Ct
- 3461 Mearn Ct
- 3430 Cockerill Dr
- 3430 Cockerill Dr Lot#16
- 2050 Button Place Lot#32
- 2050 Button Place Unit Lot 32
- 2050 Button Place
- 3434 Mearn Ct
- 3402 Mearn Ct
- 2028 Button Place Unit Lot 31
- 2028 Button Place
- 3450 Cockerill Dr
- 3450 Mearn Ct
- 2006 Button Place
- 2094 Button Place
- 3491 Mearn Ct
Your Personal Tour Guide
Ask me questions while you tour the home.