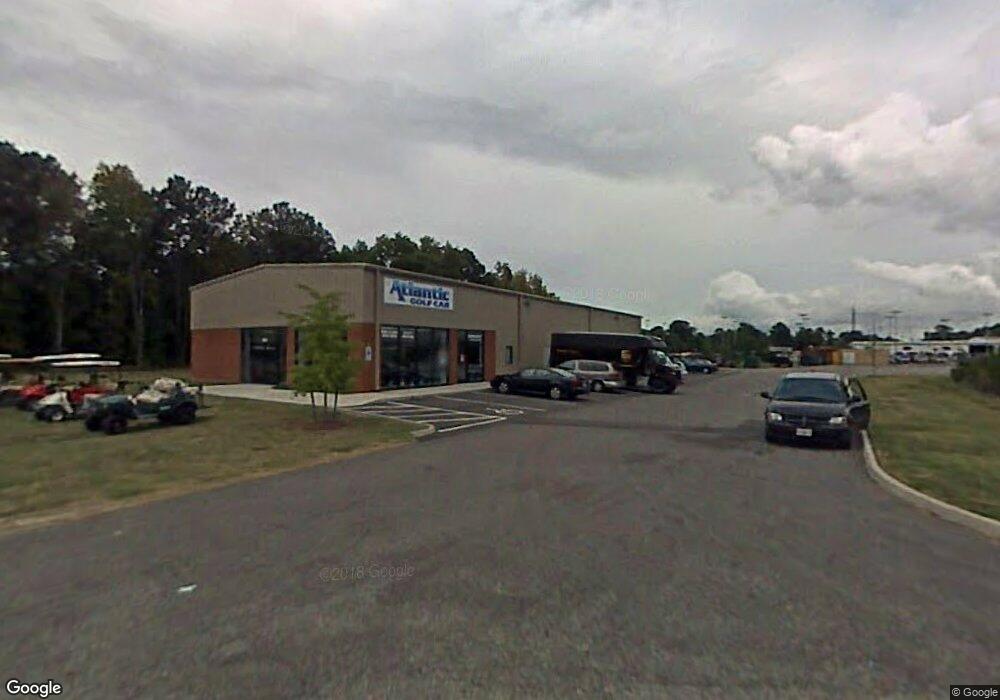
2017 Georgetown Blvd Chesapeake, VA 23325
Indian River NeighborhoodEstimated Value: $1,409,421
--
Bed
--
Bath
6,000
Sq Ft
$235/Sq Ft
Est. Value
About This Home
This home is located at 2017 Georgetown Blvd, Chesapeake, VA 23325 and is currently estimated at $1,409,421, approximately $234 per square foot. 2017 Georgetown Blvd is a home located in Chesapeake City with nearby schools including Georgetown Primary School, Sparrow Road Intermediate School, and Indian River Middle.
Ownership History
Date
Name
Owned For
Owner Type
Purchase Details
Closed on
Feb 23, 2010
Sold by
Hadley Properties Llc
Bought by
Lovato Electric Inc
Current Estimated Value
Purchase Details
Closed on
Aug 27, 2003
Sold by
Retail Property Assocs
Bought by
Hadley Properties L L C
Home Financials for this Owner
Home Financials are based on the most recent Mortgage that was taken out on this home.
Original Mortgage
$440,000
Interest Rate
5.8%
Mortgage Type
Construction
Create a Home Valuation Report for This Property
The Home Valuation Report is an in-depth analysis detailing your home's value as well as a comparison with similar homes in the area
Home Values in the Area
Average Home Value in this Area
Purchase History
| Date | Buyer | Sale Price | Title Company |
|---|---|---|---|
| Lovato Electric Inc | $825,000 | -- | |
| Hadley Properties L L C | $200,000 | -- |
Source: Public Records
Mortgage History
| Date | Status | Borrower | Loan Amount |
|---|---|---|---|
| Previous Owner | Hadley Properties L L C | $440,000 |
Source: Public Records
Tax History Compared to Growth
Tax History
| Year | Tax Paid | Tax Assessment Tax Assessment Total Assessment is a certain percentage of the fair market value that is determined by local assessors to be the total taxable value of land and additions on the property. | Land | Improvement |
|---|---|---|---|---|
| 2025 | $17,931 | $1,791,300 | $501,500 | $1,289,800 |
| 2024 | $17,931 | $1,775,300 | $501,500 | $1,273,800 |
| 2023 | $15,103 | $1,739,300 | $501,500 | $1,237,800 |
| 2022 | $14,569 | $1,442,500 | $501,500 | $941,000 |
| 2021 | $13,706 | $1,305,300 | $501,500 | $803,800 |
| 2020 | $13,648 | $1,299,800 | $501,500 | $798,300 |
| 2019 | $11,622 | $1,106,900 | $501,500 | $605,400 |
| 2018 | $11,622 | $1,106,900 | $501,500 | $605,400 |
| 2017 | $11,622 | $1,106,900 | $501,500 | $605,400 |
| 2016 | $8,435 | $803,300 | $501,500 | $301,800 |
| 2015 | $8,287 | $789,200 | $501,500 | $287,700 |
| 2014 | $8,287 | $789,200 | $501,500 | $287,700 |
Source: Public Records
Map
Nearby Homes
- 25 King George Quay
- 41 King George Quay
- 2130 Rock Creek Dr
- 2053 Allison Dr
- 2145 Lloyd Dr
- 2209 Georgetown Blvd
- 2034 Allison Dr
- 2001 Candlelight Dr
- 200 Fillmore Place
- 2223 Holly Berry Ln
- 2806 Omar St
- 2701 Omar St
- 2144 Campostella Rd
- 2535 Dexter St E
- 645 Milby Dr
- 2820 Garrett St
- 2054 Midway Ave
- 2924 Candlewood Cir
- 2236 Vicker Ave
- 2905 Doris Ave
- 11 King George Quay
- 13 King George Quay
- 15 King George Quay
- 7 King George Quay
- 5 King George Quay
- 17 King George Quay
- 3 King George Quay
- 21 King George Quay
- 1 King George Quay
- 23 King George Quay
- 27 King George Quay
- 1729 S Military Hwy
- 29 King George Quay
- 31 King George Quay
- 73 Colonial Way
- 33 King George Quay
- 1725 S Military Hwy
- 71 Colonial Way
- 35 King George Quay
- 12 King George Quay