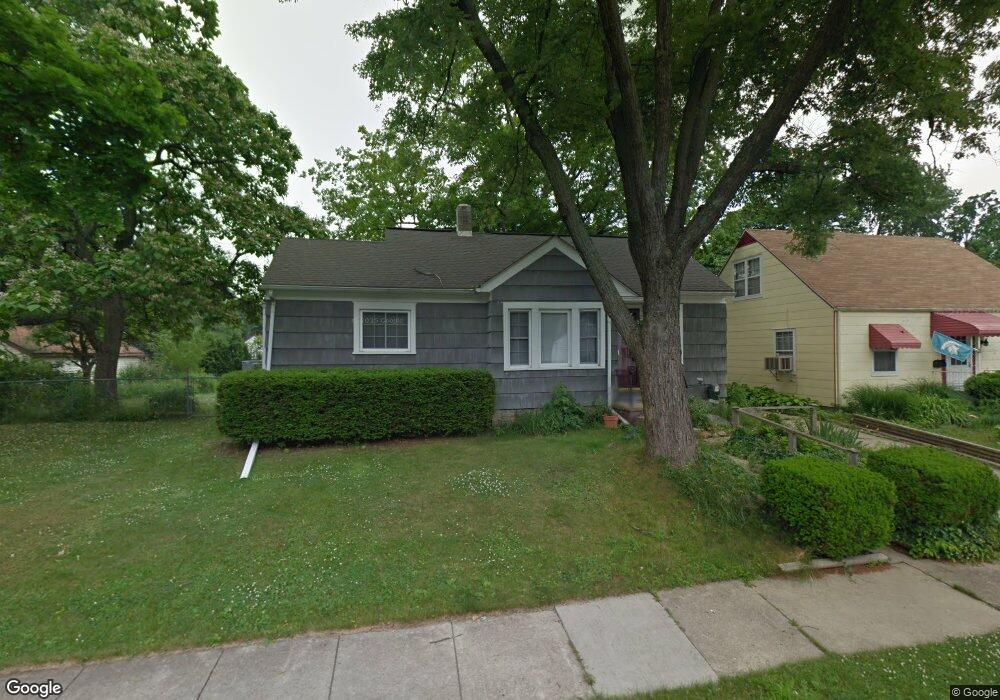
2017 Harding Ave Lansing, MI 48910
Clifford Park NeighborhoodEstimated Value: $128,889 - $148,000
Studio
--
Bath
809
Sq Ft
$169/Sq Ft
Est. Value
About This Home
This home is located at 2017 Harding Ave, Lansing, MI 48910 and is currently estimated at $136,472, approximately $168 per square foot. 2017 Harding Ave is a home located in Ingham County with nearby schools including Lyons Elementary School, Pattengill Academy, and Eastern High School.
Ownership History
Date
Name
Owned For
Owner Type
Purchase Details
Closed on
Jul 16, 2004
Sold by
Clark Margaret E
Bought by
Carmichael Kristi
Current Estimated Value
Home Financials for this Owner
Home Financials are based on the most recent Mortgage that was taken out on this home.
Original Mortgage
$97,000
Outstanding Balance
$49,029
Interest Rate
6.4%
Mortgage Type
New Conventional
Estimated Equity
$87,443
Purchase Details
Closed on
Jun 3, 2002
Sold by
Groth Jill T and Jill Thomson N
Bought by
Clark Margaret E
Home Financials for this Owner
Home Financials are based on the most recent Mortgage that was taken out on this home.
Original Mortgage
$89,700
Interest Rate
6.91%
Purchase Details
Closed on
Apr 9, 2002
Sold by
Groth Jill T and Jill Thomson N
Bought by
Groth William P and Groth Jill T
Home Financials for this Owner
Home Financials are based on the most recent Mortgage that was taken out on this home.
Original Mortgage
$89,700
Interest Rate
6.91%
Purchase Details
Closed on
Jan 30, 1998
Sold by
Belknap Janet E
Bought by
Thomson N Jill
Create a Home Valuation Report for This Property
The Home Valuation Report is an in-depth analysis detailing your home's value as well as a comparison with similar homes in the area
Home Values in the Area
Average Home Value in this Area
Purchase History
| Date | Buyer | Sale Price | Title Company |
|---|---|---|---|
| Carmichael Kristi | $100,000 | Midstate | |
| Clark Margaret E | $92,500 | -- | |
| Groth William P | -- | -- | |
| Thomson N Jill | $59,200 | -- |
Source: Public Records
Mortgage History
| Date | Status | Borrower | Loan Amount |
|---|---|---|---|
| Open | Carmichael Kristi | $97,000 | |
| Previous Owner | Clark Margaret E | $89,700 | |
| Previous Owner | Groth William P | $76,415 | |
| Closed | Carmichael Kristi | $4,716 |
Source: Public Records
Tax History
| Year | Tax Paid | Tax Assessment Tax Assessment Total Assessment is a certain percentage of the fair market value that is determined by local assessors to be the total taxable value of land and additions on the property. | Land | Improvement |
|---|---|---|---|---|
| 2025 | $3,164 | $65,600 | $17,900 | $47,700 |
| 2024 | $25 | $57,800 | $17,900 | $39,900 |
| 2023 | $2,966 | $54,500 | $17,900 | $36,600 |
| 2022 | $2,673 | $48,500 | $16,800 | $31,700 |
| 2021 | $2,618 | $45,500 | $14,400 | $31,100 |
| 2020 | $2,602 | $44,200 | $14,400 | $29,800 |
| 2019 | $2,494 | $42,100 | $14,400 | $27,700 |
| 2018 | $3,058 | $40,800 | $14,400 | $26,400 |
| 2017 | $2,945 | $40,800 | $14,400 | $26,400 |
| 2016 | $2,951 | $39,900 | $14,400 | $25,500 |
| 2015 | $2,951 | $38,600 | $28,734 | $9,866 |
| 2014 | $2,951 | $39,700 | $35,595 | $4,105 |
Source: Public Records
Map
Nearby Homes
- 2215 Alpha St
- 2201 S Pennsylvania Ave
- 2237 Sunnyside Ave
- 0 E Mount Hope Ave
- 2340 S Pennsylvania Ave
- 1718 Donora St
- 1501 Shubel Ave
- 1731 Lyons Ave
- 704 Mckim Ave
- 2118 Roberts Ln
- 616 Isbell St
- 1423 Pontiac St
- 1437 Ada St
- 1535 Linval St
- 1515 Linval St
- 534 Isbell St
- 2015 Forest Rd
- 1200 S Holmes St
- 1731 Herbert St
- 1134 S Holmes St
- 2021 Harding Ave
- 2011 Harding Ave
- 2005 Harding Ave
- 2025 Harding Ave
- 2016 Clifton Ave
- 2012 Clifton Ave
- 2020 Clifton Ave
- 2029 Harding Ave
- 1304 Elmore St
- 2024 Clifton Ave
- 2004 Clifton Ave
- 2014 Harding Ave
- 2018 Harding Ave
- 2022 Harding Ave
- 2008 Harding Ave
- 2030 Clifton Ave
- 2000 Clifton Ave
- 2033 Harding Ave
- 2004 Harding Ave
- 2026 Harding Ave
Your Personal Tour Guide
Ask me questions while you tour the home.