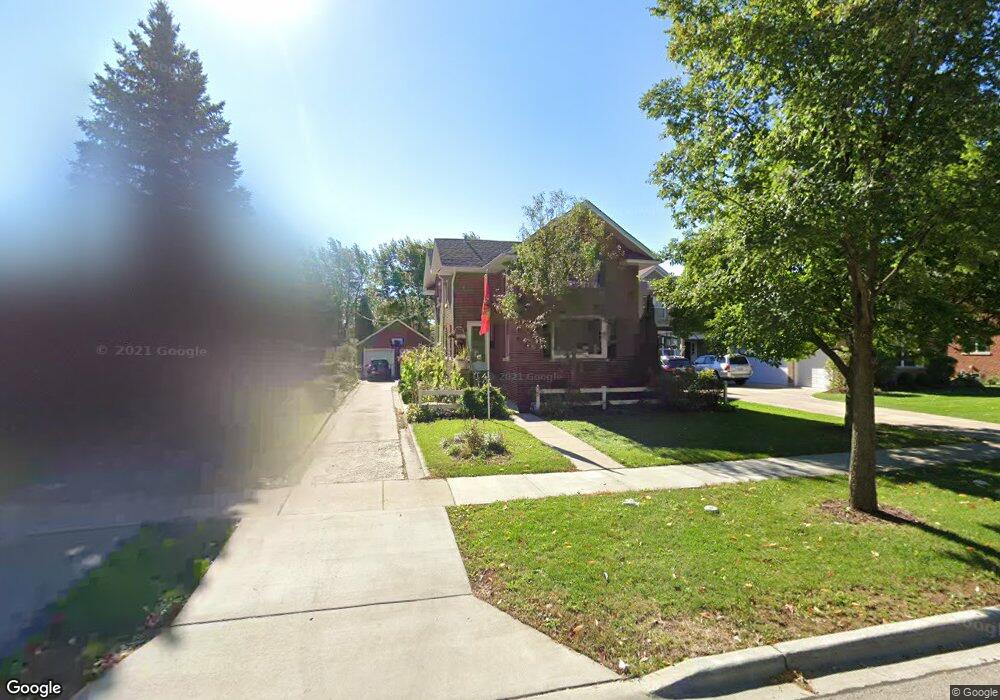
2017 Henley St Glenview, IL 60025
Estimated Value: $712,000 - $1,133,000
4
Beds
2
Baths
2,122
Sq Ft
$438/Sq Ft
Est. Value
About This Home
This home is located at 2017 Henley St, Glenview, IL 60025 and is currently estimated at $930,050, approximately $438 per square foot. 2017 Henley St is a home located in Cook County with nearby schools including Hoffman Elementary School, Henking Elementary School, and Springman Middle School.
Ownership History
Date
Name
Owned For
Owner Type
Purchase Details
Closed on
Mar 28, 1994
Sold by
Bell Robert S and Young Bell Holly F
Bought by
Bell Robert S and Young Bell Holly F
Current Estimated Value
Home Financials for this Owner
Home Financials are based on the most recent Mortgage that was taken out on this home.
Original Mortgage
$144,950
Interest Rate
7.35%
Create a Home Valuation Report for This Property
The Home Valuation Report is an in-depth analysis detailing your home's value as well as a comparison with similar homes in the area
Home Values in the Area
Average Home Value in this Area
Purchase History
| Date | Buyer | Sale Price | Title Company |
|---|---|---|---|
| Bell Robert S | -- | -- |
Source: Public Records
Mortgage History
| Date | Status | Borrower | Loan Amount |
|---|---|---|---|
| Closed | Bell Robert S | $144,950 |
Source: Public Records
Tax History
| Year | Tax Paid | Tax Assessment Tax Assessment Total Assessment is a certain percentage of the fair market value that is determined by local assessors to be the total taxable value of land and additions on the property. | Land | Improvement |
|---|---|---|---|---|
| 2025 | $13,287 | $79,001 | $19,333 | $59,668 |
| 2024 | $13,287 | $60,800 | $16,280 | $44,520 |
| 2023 | $12,872 | $66,000 | $16,280 | $49,720 |
| 2022 | $12,872 | $66,000 | $16,280 | $49,720 |
| 2021 | $9,497 | $44,150 | $12,464 | $31,686 |
| 2020 | $9,485 | $44,150 | $12,464 | $31,686 |
| 2019 | $10,120 | $48,517 | $12,464 | $36,053 |
| 2018 | $11,695 | $50,848 | $10,938 | $39,910 |
| 2017 | $10,023 | $50,848 | $10,938 | $39,910 |
| 2016 | $9,850 | $50,848 | $10,938 | $39,910 |
| 2015 | $8,242 | $37,232 | $8,903 | $28,329 |
| 2014 | $9,253 | $42,151 | $8,903 | $33,248 |
| 2013 | $8,958 | $42,151 | $8,903 | $33,248 |
Source: Public Records
Map
Nearby Homes
- 2015 Henley St
- 2023 Henley St
- 2011 Henley St
- 2027 Henley St
- 2005 Henley St
- 2018 Linneman St
- 2022 Linneman St
- 2014 Linneman St
- 2001 Henley St
- 2010 Linneman St
- 2028 Linneman St
- 2101 Henley St
- 2006 Linneman St
- 2016 Henley St
- 2014 Henley St
- 2024 Henley St
- 2010 Henley St
- 2107 Henley St
- 2000 Linneman St
- 905 Elm St