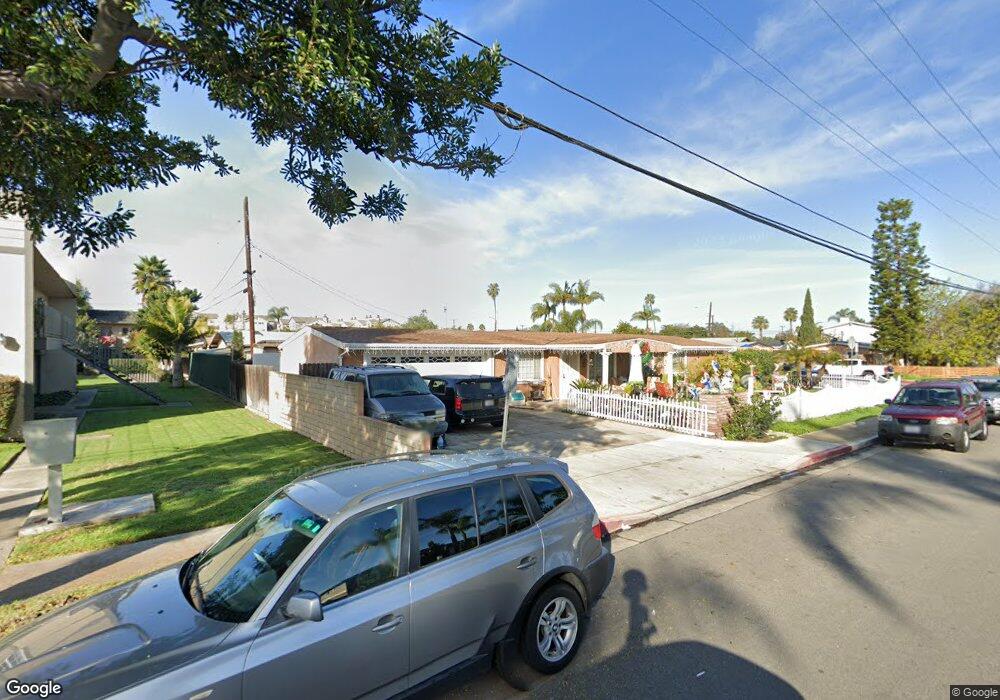
2017 Maple Ave Costa Mesa, CA 92627
Downtown Costa Mesa NeighborhoodEstimated Value: $1,108,000 - $1,308,821
3
Beds
2
Baths
1,277
Sq Ft
$943/Sq Ft
Est. Value
About This Home
This home is located at 2017 Maple Ave, Costa Mesa, CA 92627 and is currently estimated at $1,203,955, approximately $942 per square foot. 2017 Maple Ave is a home located in Orange County with nearby schools including Everett A. Rea Elementary School, Charles W. Tewinkle Middle School, and Estancia High School.
Ownership History
Date
Name
Owned For
Owner Type
Purchase Details
Closed on
Feb 12, 2001
Sold by
Marquez Maria E and Marquez Maria Elena
Bought by
Marquez Jesus M
Current Estimated Value
Home Financials for this Owner
Home Financials are based on the most recent Mortgage that was taken out on this home.
Original Mortgage
$210,000
Outstanding Balance
$76,025
Interest Rate
7.11%
Estimated Equity
$1,127,930
Purchase Details
Closed on
Sep 20, 1999
Sold by
Miroslaw Jaroslawski and Miroslaw Barbara Jaroslawski
Bought by
Marquez Jesus M and Marquez Maria E
Home Financials for this Owner
Home Financials are based on the most recent Mortgage that was taken out on this home.
Original Mortgage
$200,256
Interest Rate
7.97%
Mortgage Type
FHA
Create a Home Valuation Report for This Property
The Home Valuation Report is an in-depth analysis detailing your home's value as well as a comparison with similar homes in the area
Home Values in the Area
Average Home Value in this Area
Purchase History
| Date | Buyer | Sale Price | Title Company |
|---|---|---|---|
| Marquez Jesus M | -- | Benefit Land Title | |
| Marquez Jesus M | $206,500 | Guardian Title Company |
Source: Public Records
Mortgage History
| Date | Status | Borrower | Loan Amount |
|---|---|---|---|
| Open | Marquez Jesus M | $210,000 | |
| Closed | Marquez Jesus M | $200,256 |
Source: Public Records
Tax History
| Year | Tax Paid | Tax Assessment Tax Assessment Total Assessment is a certain percentage of the fair market value that is determined by local assessors to be the total taxable value of land and additions on the property. | Land | Improvement |
|---|---|---|---|---|
| 2025 | $4,422 | $330,549 | $245,565 | $84,984 |
| 2024 | $4,422 | $324,068 | $240,750 | $83,318 |
| 2023 | $4,250 | $317,714 | $236,029 | $81,685 |
| 2022 | $4,069 | $311,485 | $231,401 | $80,084 |
| 2021 | $3,927 | $305,378 | $226,864 | $78,514 |
| 2020 | $3,875 | $302,247 | $224,538 | $77,709 |
| 2019 | $3,793 | $296,321 | $220,135 | $76,186 |
| 2018 | $3,717 | $290,511 | $215,818 | $74,693 |
| 2017 | $3,658 | $284,815 | $211,586 | $73,229 |
| 2016 | $3,585 | $279,231 | $207,437 | $71,794 |
| 2015 | $3,550 | $275,037 | $204,321 | $70,716 |
| 2014 | $3,473 | $269,650 | $200,319 | $69,331 |
Source: Public Records
Map
Nearby Homes
- 1953 Maple Ave
- 1974 Meyer Place Unit D
- 451 Parker Dam Rd Unit B-11
- 155 Unit A Flower
- 525 Fairfax Dr Unit 2
- 525 Fairfax Dr Unit 28
- 425 Ford Rd
- 401 Bernard St Unit 202
- 329 Ford Rd
- 416 Hamilton St
- 1973 Newport Blvd Unit 3
- 1973 Newport Blvd Unit 10
- 2191 Harbor Blvd Unit 65
- 2191 Harbor Blvd Unit 75
- 2191 Harbor Blvd Unit 3
- 2191 Harbor Blvd Unit 64
- 404 Brighton Springs
- 2187 Meyer Place
- 1845 Anaheim Ave Unit 19
- 686 Governor St
- 581 Yorkshire St
- 583 Yorkshire St
- 2027 Maple Ave
- 580 Yorkshire St
- 2003 Maple Ave
- 2000 Maple Ave
- 585 Yorkshire St
- 584 Yorkshire St
- 2002 Maple Ave
- 2033 Maple Ave
- 586 Yorkshire St
- 587 Yorkshire St
- 2008 Anaheim Ave
- 588 Yorkshire St
- 2037 Maple Ave
- 2002 Anaheim Ave
- 1995 Maple Ave
- 2000 Anaheim Ave
- 1986 Maple Ave
- 2014 Maple Ave
Your Personal Tour Guide
Ask me questions while you tour the home.