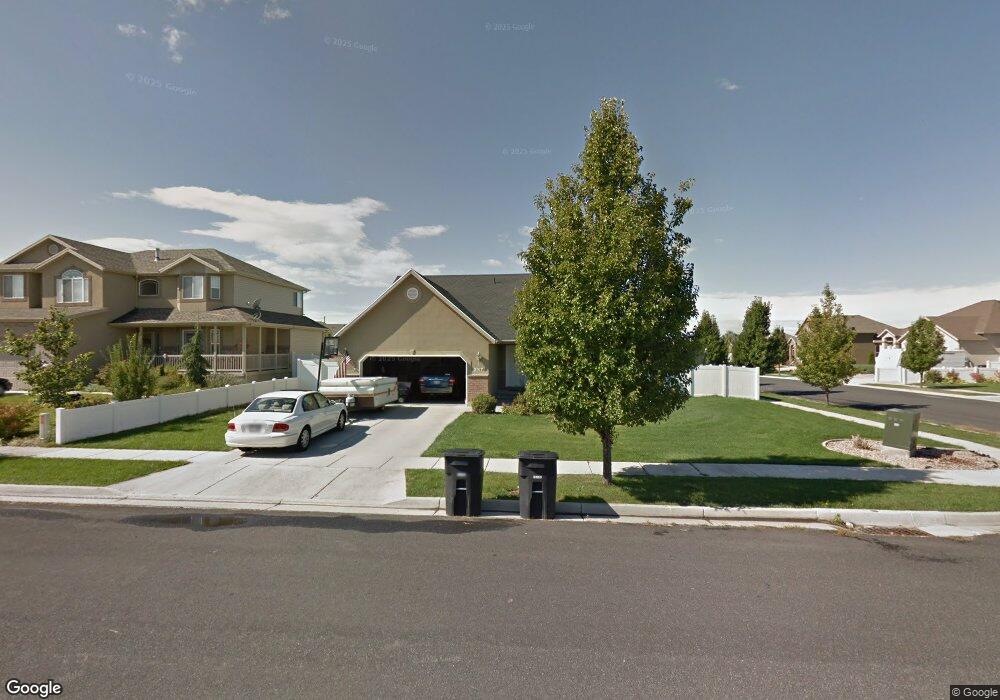
2017 N 2595 W Clinton, UT 84015
Estimated Value: $463,000 - $533,000
4
Beds
3
Baths
2,211
Sq Ft
$222/Sq Ft
Est. Value
About This Home
This home is located at 2017 N 2595 W, Clinton, UT 84015 and is currently estimated at $491,578, approximately $222 per square foot. 2017 N 2595 W is a home located in Davis County with nearby schools including West Clinton Elementary School, West Point Junior High School, and Clearfield High School.
Ownership History
Date
Name
Owned For
Owner Type
Purchase Details
Closed on
Dec 1, 2016
Sold by
Smith Cheryl Lynn
Bought by
Jacobsen Tanner and Jacobsen Danielle
Current Estimated Value
Purchase Details
Closed on
Jan 26, 2005
Sold by
Mark Higley Construction Lc
Bought by
Smith Cheryl Lynn
Home Financials for this Owner
Home Financials are based on the most recent Mortgage that was taken out on this home.
Original Mortgage
$138,908
Interest Rate
5.67%
Mortgage Type
Purchase Money Mortgage
Purchase Details
Closed on
Aug 17, 2004
Sold by
M & D Developers Llc
Bought by
Mark Higley Construction Lc
Home Financials for this Owner
Home Financials are based on the most recent Mortgage that was taken out on this home.
Original Mortgage
$118,500
Interest Rate
5.97%
Mortgage Type
Construction
Create a Home Valuation Report for This Property
The Home Valuation Report is an in-depth analysis detailing your home's value as well as a comparison with similar homes in the area
Home Values in the Area
Average Home Value in this Area
Purchase History
| Date | Buyer | Sale Price | Title Company |
|---|---|---|---|
| Jacobsen Tanner | -- | First American Title | |
| Smith Cheryl Lynn | -- | Heritage West Title Ins Agen | |
| Mark Higley Construction Lc | -- | Heritage West Title Insuranc |
Source: Public Records
Mortgage History
| Date | Status | Borrower | Loan Amount |
|---|---|---|---|
| Previous Owner | Smith Cheryl Lynn | $138,908 | |
| Previous Owner | Mark Higley Construction Lc | $118,500 |
Source: Public Records
Tax History
| Year | Tax Paid | Tax Assessment Tax Assessment Total Assessment is a certain percentage of the fair market value that is determined by local assessors to be the total taxable value of land and additions on the property. | Land | Improvement |
|---|---|---|---|---|
| 2025 | $2,523 | $242,550 | $85,976 | $156,574 |
| 2024 | $2,424 | $234,300 | $94,491 | $139,809 |
| 2023 | $2,332 | $417,000 | $107,532 | $309,468 |
| 2022 | $2,524 | $249,700 | $65,749 | $183,951 |
| 2021 | $2,364 | $347,000 | $82,358 | $264,642 |
| 2020 | $2,059 | $299,000 | $70,005 | $228,995 |
| 2019 | $2,044 | $290,000 | $81,761 | $208,239 |
| 2018 | $1,887 | $263,000 | $69,052 | $193,948 |
| 2016 | $1,612 | $116,050 | $26,894 | $89,156 |
| 2015 | $1,568 | $107,305 | $26,894 | $80,411 |
| 2014 | $1,602 | $111,367 | $26,894 | $84,473 |
| 2013 | -- | $101,317 | $27,143 | $74,174 |
Source: Public Records
Map
Nearby Homes
- 1958 N 2750 W
- Harvard Plan at Summerfield - Enclave
- Linden Plan at Summerfield - Vista
- Yale Plan at Summerfield - Enclave
- Stonehaven Plan at Summerfield - Vista
- Gambel Oak Plan at Summerfield - Vista
- Cedar Plan at Summerfield - Vista
- Elm Plan at Summerfield - Vista
- Princeton Plan at Summerfield - Enclave
- Cambridge Plan at Summerfield - Enclave
- Cornell Plan at Summerfield - Enclave
- Amesbury Plan at Summerfield - Vista
- Sycamore Plan at Summerfield - Vista
- Berkeley Plan at Summerfield - Enclave
- Birch Plan at Summerfield - Vista
- Stanford Plan at Summerfield - Enclave
- 2219 N 2475 W
- 1881 N 2350 W Unit 110
- 1727 N 2700 W
- 2434 W 2250 N
Your Personal Tour Guide
Ask me questions while you tour the home.