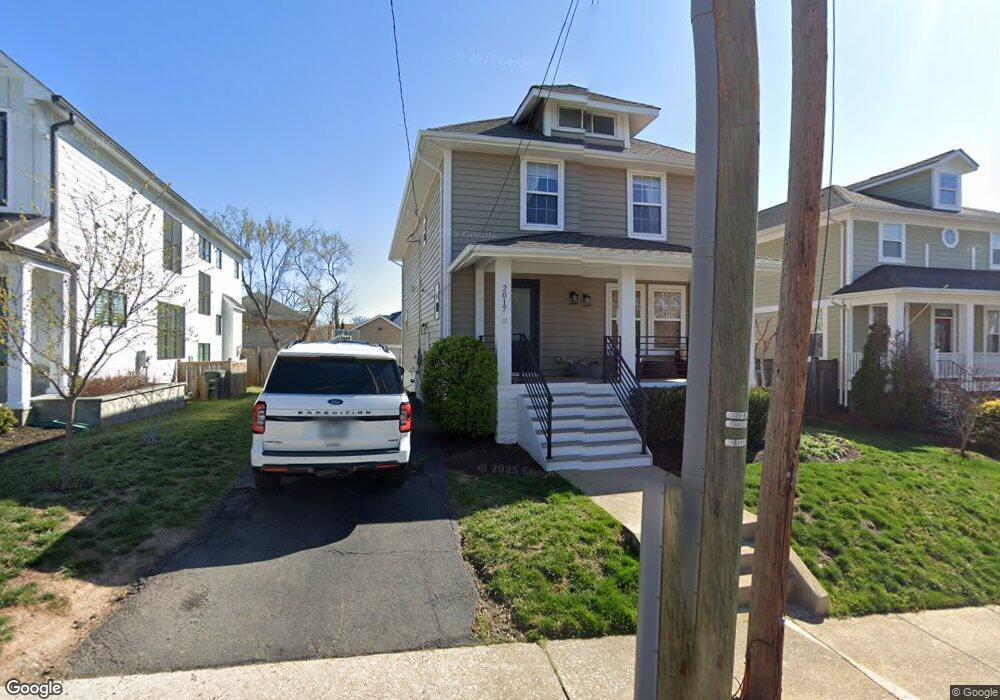
2017 N Dinwiddie St Arlington, VA 22207
High View Park NeighborhoodEstimated Value: $1,214,000 - $1,248,000
4
Beds
4
Baths
2,596
Sq Ft
$475/Sq Ft
Est. Value
About This Home
This home is located at 2017 N Dinwiddie St, Arlington, VA 22207 and is currently estimated at $1,234,113, approximately $475 per square foot. 2017 N Dinwiddie St is a home located in Arlington County with nearby schools including Glebe Elementary School, Swanson Middle School, and Yorktown High School.
Ownership History
Date
Name
Owned For
Owner Type
Purchase Details
Closed on
Sep 13, 2021
Sold by
Donnelly Michael T
Bought by
Donnelly Michael T and Donnelly Lisa
Current Estimated Value
Home Financials for this Owner
Home Financials are based on the most recent Mortgage that was taken out on this home.
Original Mortgage
$888,000
Outstanding Balance
$808,970
Interest Rate
2.88%
Estimated Equity
$425,143
Purchase Details
Closed on
Jul 15, 2008
Sold by
Kealee Construction Llc
Bought by
Donnelly Michael T
Home Financials for this Owner
Home Financials are based on the most recent Mortgage that was taken out on this home.
Original Mortgage
$674,900
Interest Rate
6.17%
Mortgage Type
New Conventional
Purchase Details
Closed on
Feb 5, 2008
Sold by
Brown Cynthia M
Bought by
Kealee Construction Llc
Home Financials for this Owner
Home Financials are based on the most recent Mortgage that was taken out on this home.
Original Mortgage
$98,800
Interest Rate
6.2%
Mortgage Type
New Conventional
Create a Home Valuation Report for This Property
The Home Valuation Report is an in-depth analysis detailing your home's value as well as a comparison with similar homes in the area
Home Values in the Area
Average Home Value in this Area
Purchase History
| Date | Buyer | Sale Price | Title Company |
|---|---|---|---|
| Donnelly Michael T | -- | None Available | |
| Donnelly Michael T | $749,900 | -- | |
| Kealee Construction Llc | $430,000 | -- |
Source: Public Records
Mortgage History
| Date | Status | Borrower | Loan Amount |
|---|---|---|---|
| Open | Donnelly Michael T | $888,000 | |
| Closed | Donnelly Michael T | $674,900 | |
| Previous Owner | Kealee Construction Llc | $98,800 | |
| Previous Owner | Kealee Construction Llc | $350,000 |
Source: Public Records
Tax History Compared to Growth
Tax History
| Year | Tax Paid | Tax Assessment Tax Assessment Total Assessment is a certain percentage of the fair market value that is determined by local assessors to be the total taxable value of land and additions on the property. | Land | Improvement |
|---|---|---|---|---|
| 2025 | $11,592 | $1,122,200 | $713,300 | $408,900 |
| 2024 | $11,469 | $1,110,300 | $713,300 | $397,000 |
| 2023 | $10,985 | $1,066,500 | $713,300 | $353,200 |
| 2022 | $10,367 | $1,006,500 | $653,300 | $353,200 |
| 2021 | $9,810 | $952,400 | $602,800 | $349,600 |
| 2020 | $9,381 | $914,300 | $560,000 | $354,300 |
| 2019 | $8,905 | $867,900 | $525,000 | $342,900 |
| 2018 | $8,172 | $812,300 | $490,000 | $322,300 |
| 2017 | $7,392 | $734,800 | $465,000 | $269,800 |
| 2016 | $7,315 | $738,100 | $465,000 | $273,100 |
| 2015 | $7,055 | $708,300 | $460,000 | $248,300 |
| 2014 | $6,855 | $688,300 | $440,000 | $248,300 |
Source: Public Records
Map
Nearby Homes
- 2025 N Emerson St
- 5120 20th St N
- 5119 19th St N
- 4730 19th St N
- 0 N Emerson St
- 2150 Patrick Henry Dr
- 2329 N Edison St
- 4741 20th St N
- 2323 N Burlington St
- 2119 N Harrison St
- 2116 N Harrison St
- 5017 17th St N
- 1713 N Cameron St
- 5412 21st St N
- 1712 N Culpeper St
- 5411 22nd St N
- 1620 N George Mason Dr
- 5021 25th Rd N
- 2532 N Glebe Rd
- 4719 25th St N
- 2023 N Dinwiddie St
- 2023 N Dinwiddie St Unit A
- 2013 N Dinwiddie St
- 2027 N Dinwiddie St
- 2009 N Dinwiddie St
- 2024 N Cameron St
- 2036 N Cameron St
- 2031 N Dinwiddie St
- 2018 N Cameron St
- 2007 N Dinwiddie St
- 2005 N Dinwiddie St
- 2012 N Cameron St
- 2018 N Dinwiddie St
- 2022 N Dinwiddie St
- 2003 N Dinwiddie St
- 2014 N Dinwiddie St
- 2103 N Dinwiddie St
- 2040 N Cameron St
- 2010 N Dinwiddie St
- 2001 N Dinwiddie St