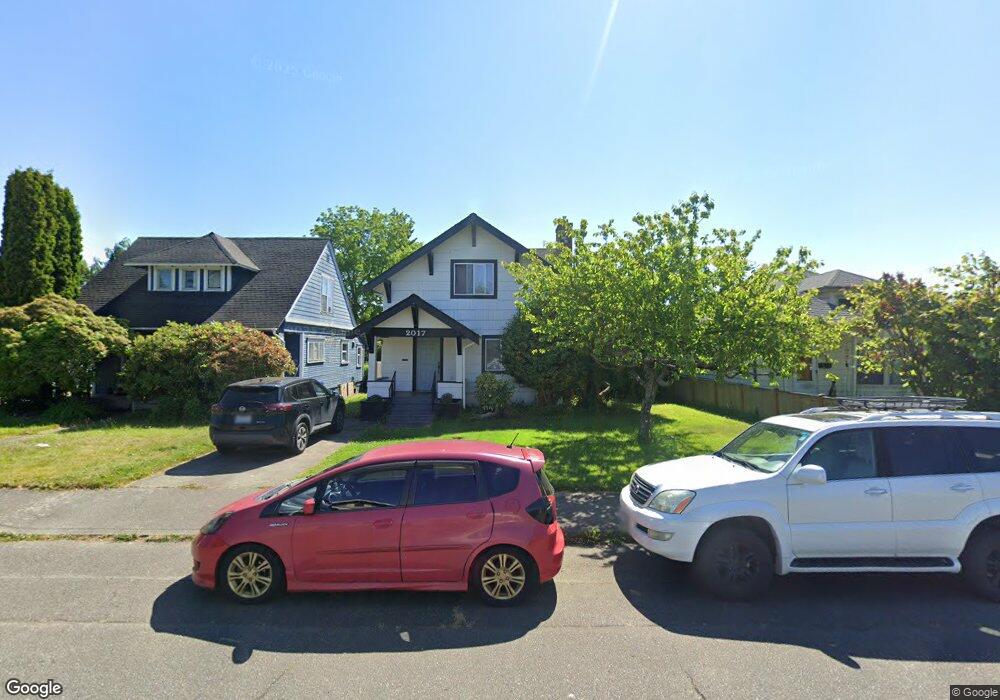
2017 Oakes Ave Everett, WA 98201
Bayside NeighborhoodEstimated Value: $477,000 - $597,000
4
Beds
1
Bath
1,226
Sq Ft
$431/Sq Ft
Est. Value
About This Home
This home is located at 2017 Oakes Ave, Everett, WA 98201 and is currently estimated at $528,436, approximately $431 per square foot. 2017 Oakes Ave is a home located in Snohomish County with nearby schools including Hawthorne Elementary School, North Middle School, and Everett High School.
Ownership History
Date
Name
Owned For
Owner Type
Purchase Details
Closed on
Oct 22, 2021
Sold by
Barneti Cheri and Estate Of Cheryl A Artack
Bought by
Sound Equity Group Llc
Current Estimated Value
Home Financials for this Owner
Home Financials are based on the most recent Mortgage that was taken out on this home.
Original Mortgage
$275,400
Outstanding Balance
$251,139
Interest Rate
2.8%
Mortgage Type
Purchase Money Mortgage
Estimated Equity
$277,297
Purchase Details
Closed on
Jun 14, 2012
Sold by
Artack Brian
Bought by
Artack Cheryl A
Purchase Details
Closed on
Sep 18, 2001
Sold by
Dinwiddie Stephen C
Bought by
Dinwiddie Cheryl A
Purchase Details
Closed on
Aug 22, 1994
Sold by
Jasper Rollin H and Jasper Rollin E
Bought by
Dinwiddie Stephen Craig and Dinwiddie Cheryl A
Home Financials for this Owner
Home Financials are based on the most recent Mortgage that was taken out on this home.
Original Mortgage
$125,970
Interest Rate
8.8%
Mortgage Type
Assumption
Create a Home Valuation Report for This Property
The Home Valuation Report is an in-depth analysis detailing your home's value as well as a comparison with similar homes in the area
Home Values in the Area
Average Home Value in this Area
Purchase History
| Date | Buyer | Sale Price | Title Company |
|---|---|---|---|
| Sound Equity Group Llc | $275,000 | First American Title | |
| Artack Cheryl A | -- | First American Title Ins Co | |
| Dinwiddie Cheryl A | -- | -- | |
| Dinwiddie Stephen Craig | $123,500 | Old Republic Title Ltd |
Source: Public Records
Mortgage History
| Date | Status | Borrower | Loan Amount |
|---|---|---|---|
| Open | Sound Equity Group Llc | $275,400 | |
| Previous Owner | Dinwiddie Stephen Craig | $125,970 |
Source: Public Records
Tax History
| Year | Tax Paid | Tax Assessment Tax Assessment Total Assessment is a certain percentage of the fair market value that is determined by local assessors to be the total taxable value of land and additions on the property. | Land | Improvement |
|---|---|---|---|---|
| 2025 | $4,085 | $507,600 | $350,000 | $157,600 |
| 2024 | $4,085 | $475,700 | $320,000 | $155,700 |
| 2023 | $3,996 | $486,600 | $345,000 | $141,600 |
| 2022 | $3,322 | $362,800 | $243,000 | $119,800 |
| 2020 | $3,190 | $284,200 | $178,000 | $106,200 |
| 2019 | $3,081 | $276,200 | $172,000 | $104,200 |
| 2018 | $3,029 | $248,900 | $156,000 | $92,900 |
| 2017 | $2,495 | $204,200 | $122,000 | $82,200 |
| 2016 | $2,172 | $186,900 | $108,000 | $78,900 |
| 2015 | $2,014 | $163,200 | $94,000 | $69,200 |
| 2013 | $2,015 | $144,100 | $80,000 | $64,100 |
Source: Public Records
Map
Nearby Homes
- 2009 Lombard Ave
- 1925 Lombard Ave Unit A
- 1925 Lombard Ave Unit A,B,C
- 1920 Broadway
- 1612 21st St
- 2005 Mcdougall Ave
- 2130 Virginia Ave
- 2217 Hoyt Ave Unit C
- 2217 Hoyt Ave Unit B
- 1721 Mcdougall Ave
- 2405 Rockefeller Ave
- 2221 Virginia Ave
- 3405 3425 Rucker Ave
- 2108 Grand Ave
- 2515 Oakes Ave
- 2302 Grand Ave
- 2707 18th St
- 1601 Virginia Ave
- 1621 Baker Ave
- 1602 Rucker Ave
- 2013 Oakes Ave
- 2021 Oakes Ave
- 2011 Oakes Ave
- 2025 Oakes Ave
- 2007 Oakes Ave
- 2029 Oakes Ave
- 2018 Lombard Ave
- 2020 Lombard Ave
- 2024 Lombard Ave
- 2031 Oakes Ave
- 2005 Oakes Ave
- 2010 Lombard Ave
- 2026 Lombard Ave Unit 3
- 2026 Lombard Ave Unit 1
- 2026 Lombard Ave
- 2030 Lombard Ave
- 2016 Oakes Ave
- 2001 Oakes Ave
- 2008 Lombard Ave
Your Personal Tour Guide
Ask me questions while you tour the home.