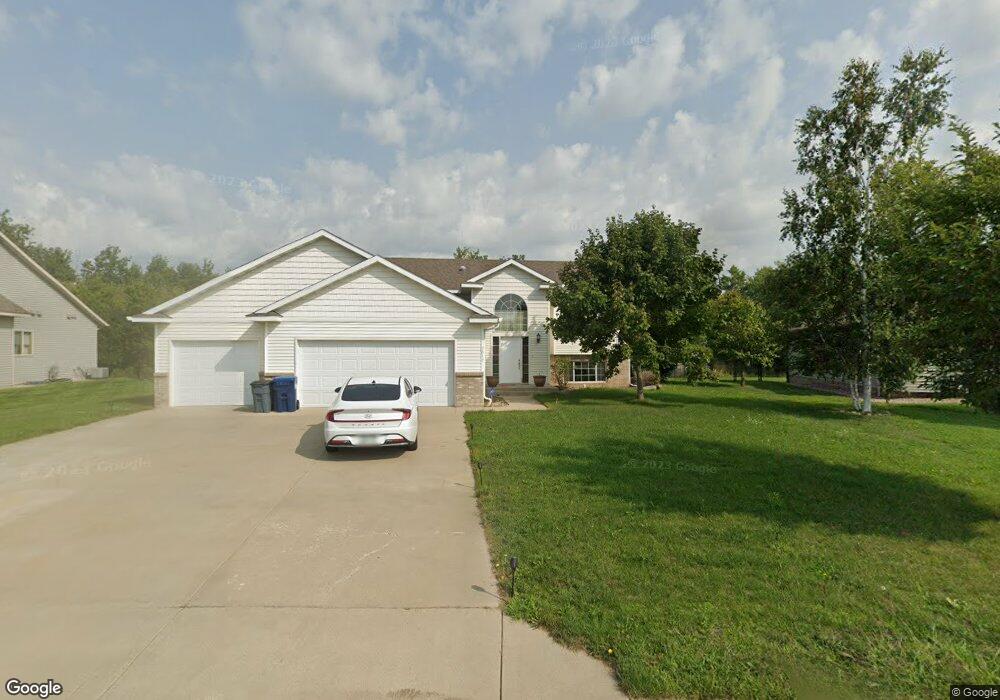
2017 Peach Dr NE Sauk Rapids, MN 56379
Estimated Value: $342,000 - $361,000
4
Beds
3
Baths
1,203
Sq Ft
$295/Sq Ft
Est. Value
About This Home
This home is located at 2017 Peach Dr NE, Sauk Rapids, MN 56379 and is currently estimated at $355,108, approximately $295 per square foot. 2017 Peach Dr NE is a home located in Benton County with nearby schools including Mississippi Heights Elementary School, Sauk Rapids-Rice Middle School, and Sauk Rapids-Rice Senior High School.
Ownership History
Date
Name
Owned For
Owner Type
Purchase Details
Closed on
Jun 22, 2018
Sold by
Otremba John F and Otremba Jennifer
Bought by
Brown Rodney
Current Estimated Value
Home Financials for this Owner
Home Financials are based on the most recent Mortgage that was taken out on this home.
Original Mortgage
$246,453
Outstanding Balance
$213,173
Interest Rate
4.6%
Mortgage Type
FHA
Estimated Equity
$141,935
Purchase Details
Closed on
Jun 6, 2008
Sold by
Cutting Edge Homes Inc
Bought by
Otremba John F
Home Financials for this Owner
Home Financials are based on the most recent Mortgage that was taken out on this home.
Original Mortgage
$174,550
Interest Rate
6.04%
Mortgage Type
VA
Purchase Details
Closed on
Jun 29, 2006
Sold by
Jmc Companies Of Mn Inc
Bought by
Cutting Edge Homes Inc
Home Financials for this Owner
Home Financials are based on the most recent Mortgage that was taken out on this home.
Original Mortgage
$143,250
Interest Rate
6.73%
Mortgage Type
Construction
Create a Home Valuation Report for This Property
The Home Valuation Report is an in-depth analysis detailing your home's value as well as a comparison with similar homes in the area
Home Values in the Area
Average Home Value in this Area
Purchase History
| Date | Buyer | Sale Price | Title Company |
|---|---|---|---|
| Brown Rodney | $251,000 | Liberty Title Inc | |
| Otremba John F | $182,000 | -- | |
| Cutting Edge Homes Inc | $54,300 | -- |
Source: Public Records
Mortgage History
| Date | Status | Borrower | Loan Amount |
|---|---|---|---|
| Open | Brown Rodney | $246,453 | |
| Previous Owner | Otremba John F | $174,550 | |
| Previous Owner | Cutting Edge Homes Inc | $143,250 |
Source: Public Records
Tax History Compared to Growth
Tax History
| Year | Tax Paid | Tax Assessment Tax Assessment Total Assessment is a certain percentage of the fair market value that is determined by local assessors to be the total taxable value of land and additions on the property. | Land | Improvement |
|---|---|---|---|---|
| 2025 | $4,146 | $338,300 | $34,800 | $303,500 |
| 2024 | $4,302 | $335,500 | $34,800 | $300,700 |
| 2023 | $4,150 | $357,100 | $34,800 | $322,300 |
| 2022 | $3,842 | $316,600 | $34,800 | $281,800 |
| 2021 | $3,460 | $269,800 | $32,400 | $237,400 |
| 2018 | $2,996 | $200,800 | $27,582 | $173,218 |
| 2017 | $2,996 | $184,600 | $27,214 | $157,386 |
| 2016 | $2,912 | $197,000 | $30,000 | $167,000 |
| 2015 | $2,936 | $162,600 | $26,612 | $135,988 |
| 2014 | -- | $154,900 | $26,358 | $128,542 |
| 2013 | -- | $123,000 | $25,102 | $97,898 |
Source: Public Records
Map
Nearby Homes
- 1526 Prairie View Ln NE
- xxx Lot 3
- 1664 Payton Ct NE
- 55xx Mayhew Lake Rd NE
- 1294 Stone Ridge Rd
- TBD Lot D Mayhew Lake Rd NE
- xxx Lot 2
- 1424 Hillside Ct
- 1408 10th St NE
- tbd 25th Ave NE
- 970 Golden Spike Rd NE
- 2148 Morningside Dr NE
- 880 Golden Spike Rd NE
- 1930 Prospect Dr NE
- 1355 Onyx Way NE
- 1000 10th Ave NE
- XXXX Golden Spike Rd NE
- 1 Skyview Dr
- 1128 29th St NE
- 2862 11th Ave NE
- 2025 Peach Dr NE
- 2009 Peach Dr NE
- 2001 Peach Dr NE
- 2033 Peach Dr NE
- 2033 2033 Ne Peach-Drive-
- 1718 20th Ave NE
- 2016 Peach Dr NE
- 1995 Peach Dr NE
- 2024 Peach Dr NE
- 1708 20th Ave NE
- 1990 Peach Dr NE
- 1715 20th Ave NE
- 2041 Peach Dr NE
- 2034 Peach Dr NE
- 1702 20th Ave NE
- 1705 20th Ave NE
- 1979 Peach Dr NE
- 1698 20th Ave NE
- 1978 Peach Dr NE
- 1974 Peach Dr NE