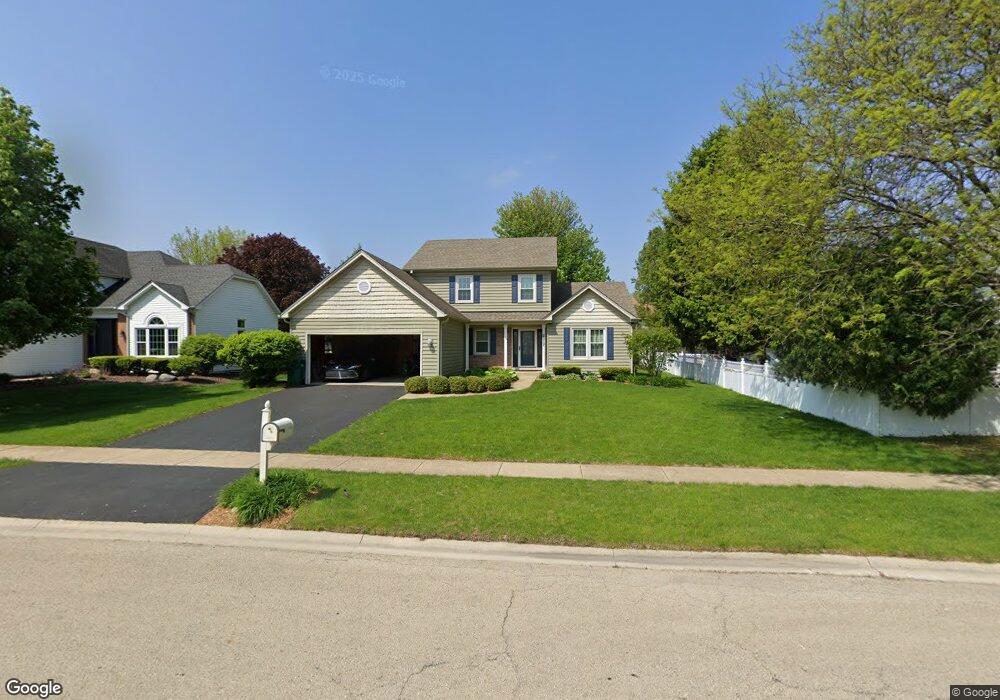
2017 St Andrews Dr Plainfield, IL 60586
Fall Creek NeighborhoodEstimated Value: $384,084 - $415,000
3
Beds
3
Baths
2,300
Sq Ft
$173/Sq Ft
Est. Value
About This Home
This home is located at 2017 St Andrews Dr, Plainfield, IL 60586 and is currently estimated at $397,771, approximately $172 per square foot. 2017 St Andrews Dr is a home located in Will County with nearby schools including Wesmere Elementary School, Drauden Point Middle School, and Plainfield South High School.
Ownership History
Date
Name
Owned For
Owner Type
Purchase Details
Closed on
May 23, 2023
Sold by
Hash Phillip M and Hash Georgia L
Bought by
Rahimov Ahror and Ratsorko Ganna
Current Estimated Value
Home Financials for this Owner
Home Financials are based on the most recent Mortgage that was taken out on this home.
Original Mortgage
$292,000
Outstanding Balance
$284,399
Interest Rate
6.75%
Mortgage Type
New Conventional
Estimated Equity
$113,372
Purchase Details
Closed on
Aug 3, 1998
Sold by
Laurenti J Robert and Laurenti Janine C
Bought by
Hash Phillip M and Hash Georgia L
Home Financials for this Owner
Home Financials are based on the most recent Mortgage that was taken out on this home.
Original Mortgage
$152,000
Interest Rate
7.05%
Purchase Details
Closed on
Jun 25, 1997
Sold by
Harris Bank Naperville
Bought by
Laurenti J Rober and Laurenti Janine C
Home Financials for this Owner
Home Financials are based on the most recent Mortgage that was taken out on this home.
Original Mortgage
$153,000
Interest Rate
7.44%
Create a Home Valuation Report for This Property
The Home Valuation Report is an in-depth analysis detailing your home's value as well as a comparison with similar homes in the area
Home Values in the Area
Average Home Value in this Area
Purchase History
| Date | Buyer | Sale Price | Title Company |
|---|---|---|---|
| Rahimov Ahror | $365,000 | Fidelity National Title | |
| Hash Phillip M | $174,000 | -- | |
| Laurenti J Rober | $162,833 | -- |
Source: Public Records
Mortgage History
| Date | Status | Borrower | Loan Amount |
|---|---|---|---|
| Open | Rahimov Ahror | $292,000 | |
| Previous Owner | Hash Phillip M | $152,000 | |
| Previous Owner | Laurenti J Rober | $153,000 |
Source: Public Records
Tax History
| Year | Tax Paid | Tax Assessment Tax Assessment Total Assessment is a certain percentage of the fair market value that is determined by local assessors to be the total taxable value of land and additions on the property. | Land | Improvement |
|---|---|---|---|---|
| 2024 | $7,318 | $110,181 | $28,895 | $81,286 |
| 2023 | $7,318 | $99,513 | $26,097 | $73,416 |
| 2022 | $7,024 | $95,449 | $25,031 | $70,418 |
| 2021 | $6,659 | $89,204 | $23,393 | $65,811 |
| 2020 | $6,558 | $86,673 | $22,729 | $63,944 |
| 2019 | $6,329 | $82,585 | $21,657 | $60,928 |
| 2018 | $6,057 | $77,593 | $20,348 | $57,245 |
| 2017 | $5,875 | $73,737 | $19,337 | $54,400 |
| 2016 | $5,755 | $70,327 | $18,443 | $51,884 |
| 2015 | $5,368 | $65,880 | $17,277 | $48,603 |
| 2014 | $5,368 | $63,554 | $16,667 | $46,887 |
| 2013 | $5,368 | $63,554 | $16,667 | $46,887 |
Source: Public Records
Map
Nearby Homes
- 2010 Primrose Dr
- 2209 Irvine Ln
- 5005 Inverness Cir
- 2019 Gleneagle Dr
- 4755 Pratt Ct
- 4757 Foster Ct Unit 3
- 5304 Floralwood Ct
- 2004 Kingsbury Estates Dr
- 1814 Larkspur Dr
- 1852 Maple Glen Dr
- 1848 Maple Glen Dr
- 1700 Chestnut Hill Rd
- 5113 Wildflower Ct
- 2117 Wesmere Lakes Dr
- 2623 Old Woods Trail Unit 4
- 2110 Wynham Lakes Ct
- 5012 Norwalk Ct Unit 2
- 3040 Abbey Cir
- 3020 Abbey Cir
- 3005 Abbey Cir
- 2017 Saint Andrews Dr
- 2015 Saint Andrews Dr
- 4956 Vermette Cir
- 4958 Vermette Cir
- 2102 Glencorse Cir
- 2013 Saint Andrews Dr
- 2104 Glencorse Cir
- 2022 Saint Andrews Dr
- 2106 Saint Andrews Dr
- 5000 Vermette Cir
- 2018 Saint Andrews Dr
- 2100 Glencorse Cir
- 4997 Doral Ct
- 5002 Vermette Cir Unit 1
- 4955 Vermette Cir
- 2016 Saint Andrews Dr
- 4953 Vermette Cir Unit 1
- 2107 Primrose Dr
- 5001 Doral Ct
- 2109 Primrose Dr
Your Personal Tour Guide
Ask me questions while you tour the home.