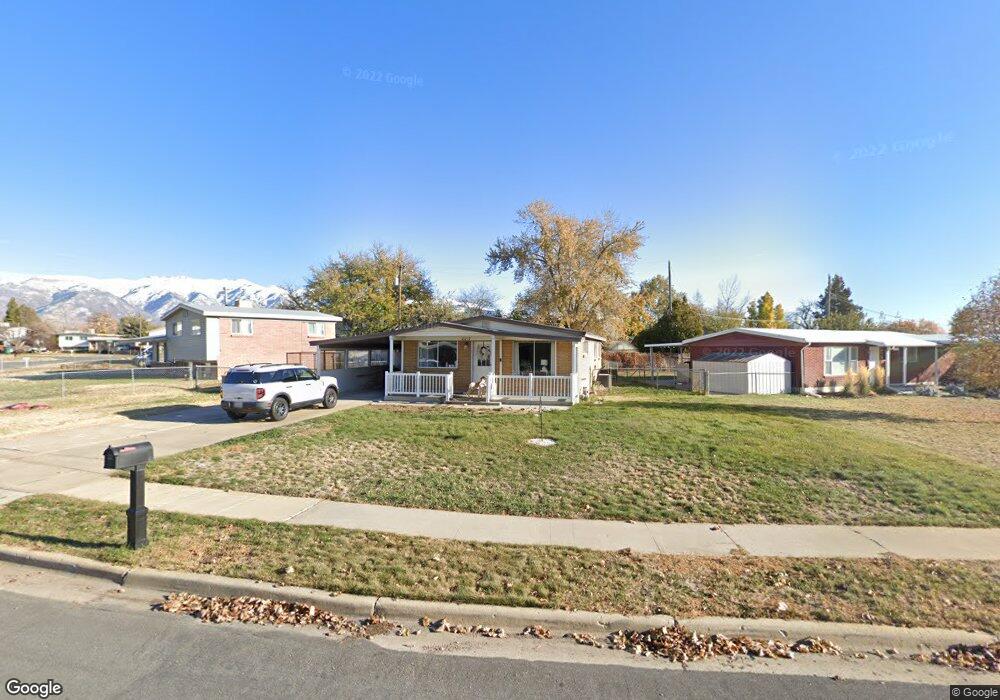
2017 W Afton Cir Layton, UT 84041
Estimated Value: $394,000 - $431,421
5
Beds
2
Baths
2,250
Sq Ft
$184/Sq Ft
Est. Value
About This Home
This home is located at 2017 W Afton Cir, Layton, UT 84041 and is currently estimated at $413,355, approximately $183 per square foot. 2017 W Afton Cir is a home located in Davis County with nearby schools including Vae View Elementary School, Central Davis Junior High School, and Layton High School.
Ownership History
Date
Name
Owned For
Owner Type
Purchase Details
Closed on
Mar 22, 2022
Sold by
Swartz Colby A and Swartz Jamie A
Bought by
Swartz Colby and Washburn Jamie
Current Estimated Value
Home Financials for this Owner
Home Financials are based on the most recent Mortgage that was taken out on this home.
Original Mortgage
$246,000
Outstanding Balance
$232,817
Interest Rate
4.16%
Mortgage Type
New Conventional
Estimated Equity
$185,663
Purchase Details
Closed on
Jul 30, 2020
Sold by
Schultz Dale and Colunga Jack T
Bought by
Swartz Colby and Washburn Jamie
Home Financials for this Owner
Home Financials are based on the most recent Mortgage that was taken out on this home.
Original Mortgage
$216,800
Interest Rate
3.1%
Mortgage Type
New Conventional
Purchase Details
Closed on
Jul 15, 2009
Sold by
Colunga Lupe and Colunga Reta F
Bought by
Colunga Lupe and Colunga Reta F
Create a Home Valuation Report for This Property
The Home Valuation Report is an in-depth analysis detailing your home's value as well as a comparison with similar homes in the area
Home Values in the Area
Average Home Value in this Area
Purchase History
| Date | Buyer | Sale Price | Title Company |
|---|---|---|---|
| Swartz Colby | -- | None Listed On Document | |
| Swartz Colby | -- | Stewart Title Ins Age | |
| Colunga Lupe | -- | None Available |
Source: Public Records
Mortgage History
| Date | Status | Borrower | Loan Amount |
|---|---|---|---|
| Open | Swartz Colby | $246,000 | |
| Previous Owner | Swartz Colby | $216,800 |
Source: Public Records
Tax History Compared to Growth
Tax History
| Year | Tax Paid | Tax Assessment Tax Assessment Total Assessment is a certain percentage of the fair market value that is determined by local assessors to be the total taxable value of land and additions on the property. | Land | Improvement |
|---|---|---|---|---|
| 2024 | $2,018 | $213,400 | $122,114 | $91,286 |
| 2023 | $1,931 | $360,000 | $160,162 | $199,838 |
| 2022 | $2,103 | $212,850 | $74,847 | $138,003 |
| 2021 | $1,901 | $287,000 | $106,115 | $180,885 |
| 2020 | $1,547 | $224,000 | $77,948 | $146,052 |
| 2019 | $1,544 | $219,000 | $74,952 | $144,048 |
| 2018 | $1,341 | $191,000 | $69,400 | $121,600 |
| 2016 | $1,165 | $85,580 | $20,022 | $65,558 |
| 2015 | $1,116 | $77,825 | $20,022 | $57,803 |
| 2014 | $1,160 | $82,724 | $20,022 | $62,702 |
| 2013 | -- | $73,087 | $20,680 | $52,407 |
Source: Public Records
Map
Nearby Homes
- 1847 John St
- 1645 N Celia Way
- 1596 N Main St Unit 2
- 1949 W 1620 N
- 1937 W 1620 N
- 939 E Sam Cir
- 1501 N Celia Way
- 1900 N 1690 W
- 2114 S 825 E
- 1430 N 2100 W
- 1491 N 1875 W Unit 158
- 1665 W 1960 N
- 1850 S 875 E
- 1476 N 1875 W Unit 164
- 1487 N 1875 W Unit 159
- 1463 N 1875 W
- 1463 N 1875 W Unit 165
- 1459 N 1875 W
- 1459 N 1875 W Unit 166
- 1459 N 1875 W Unit 167
- 1820 N Afton Cir
- 1995 W Afton Cir
- 1995 Ann St
- 1821 N Gregory Dr
- 1823 N Gregory Dr
- 1800 N Afton Cir
- 1847 N Afton Cir
- 2014 W Afton Cir
- 1835 N Afton Cir
- 1811 N Mark St
- 1998 W Afton Cir
- 1983 W Afton Cir
- 1821 N Afton Cir
- 1821 N Afton Cir
- 1992 W Afton Cir
- 1782 N Afton Cir
- 1805 N Afton Cir
- 1785 N Gregory Dr
- 1986 W Afton Cir
- 1783 N Afton Cir