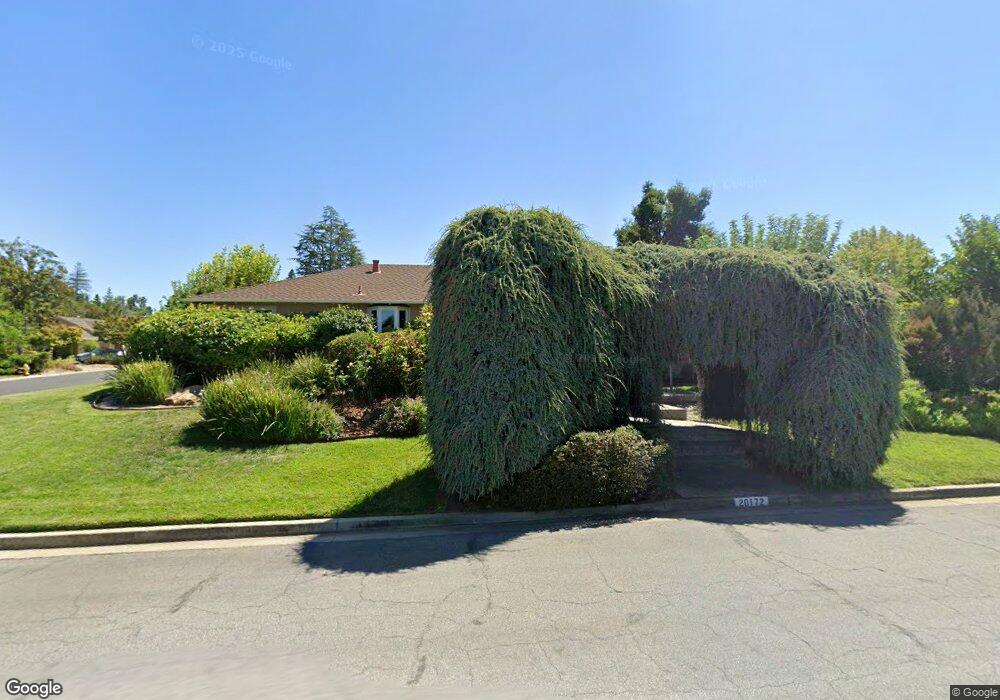
20172 Glen Brae Dr Saratoga, CA 95070
The Golden Triangle NeighborhoodEstimated Value: $4,450,000 - $4,815,000
4
Beds
3
Baths
2,762
Sq Ft
$1,688/Sq Ft
Est. Value
About This Home
This home is located at 20172 Glen Brae Dr, Saratoga, CA 95070 and is currently estimated at $4,662,747, approximately $1,688 per square foot. 20172 Glen Brae Dr is a home located in Santa Clara County with nearby schools including Argonaut Elementary School, Foothill Elementary School, and Saratoga Elementary School.
Ownership History
Date
Name
Owned For
Owner Type
Purchase Details
Closed on
May 18, 2001
Sold by
Arjavalingam Gnanalingam and Arjavalingam Vasanthi K
Bought by
Arjavalingam Gnanalingam and Arjavalingam Vasanthi K
Current Estimated Value
Home Financials for this Owner
Home Financials are based on the most recent Mortgage that was taken out on this home.
Original Mortgage
$850,000
Outstanding Balance
$318,094
Interest Rate
7.06%
Estimated Equity
$4,344,653
Purchase Details
Closed on
Apr 3, 2000
Sold by
Gnanalingam Arjavalingam and Gnanalingam Vasanthi K
Bought by
Arjavalingam Gnanalingam and Arjavalingam Vasanthi K
Purchase Details
Closed on
Sep 15, 1998
Sold by
Osmun James W and Lu Helen H
Bought by
Arjavalingam Gnanalingam and Arjavalingam Vasanthi K
Home Financials for this Owner
Home Financials are based on the most recent Mortgage that was taken out on this home.
Original Mortgage
$723,750
Interest Rate
6.87%
Create a Home Valuation Report for This Property
The Home Valuation Report is an in-depth analysis detailing your home's value as well as a comparison with similar homes in the area
Home Values in the Area
Average Home Value in this Area
Purchase History
| Date | Buyer | Sale Price | Title Company |
|---|---|---|---|
| Arjavalingam Gnanalingam | -- | Fidelity National Title Co | |
| Arjavalingam Gnanalingan | -- | Fidelity National Title Co | |
| Arjavalingam Gnanalingam | -- | -- | |
| Arjavalingam Gnanalingam | $965,000 | Chicago Title Co |
Source: Public Records
Mortgage History
| Date | Status | Borrower | Loan Amount |
|---|---|---|---|
| Open | Arjavalingam Gnanalingan | $850,000 | |
| Closed | Arjavalingam Gnanalingam | $723,750 | |
| Closed | Arjavalingam Gnanalingam | $126,250 |
Source: Public Records
Tax History Compared to Growth
Tax History
| Year | Tax Paid | Tax Assessment Tax Assessment Total Assessment is a certain percentage of the fair market value that is determined by local assessors to be the total taxable value of land and additions on the property. | Land | Improvement |
|---|---|---|---|---|
| 2025 | $18,152 | $1,512,832 | $940,625 | $572,207 |
| 2024 | $18,152 | $1,483,170 | $922,182 | $560,988 |
| 2023 | $17,963 | $1,454,089 | $904,100 | $549,989 |
| 2022 | $17,569 | $1,425,578 | $886,373 | $539,205 |
| 2021 | $17,274 | $1,397,627 | $868,994 | $528,633 |
| 2020 | $16,907 | $1,383,297 | $860,084 | $523,213 |
| 2019 | $16,617 | $1,356,174 | $843,220 | $512,954 |
| 2018 | $16,323 | $1,329,584 | $826,687 | $502,897 |
| 2017 | $16,253 | $1,303,515 | $810,478 | $493,037 |
| 2016 | $15,773 | $1,277,957 | $794,587 | $483,370 |
| 2015 | $15,454 | $1,258,762 | $782,652 | $476,110 |
| 2014 | $15,121 | $1,234,105 | $767,321 | $466,784 |
Source: Public Records
Map
Nearby Homes
- 20410 Thelma Ave
- 20077 Ljepava Dr
- 19938 Baroni Ct
- 13845 Saratoga Ave
- 19740 Via Escuela Dr
- 20557 Deerpark Ct
- 19662 Via Grande Dr
- 12790 Glen Arbor Ct
- 20460 Williams Ave
- 19522 Via Real Dr
- 13010 Glen Brae Dr
- 19817 Veronica Dr
- 14275 Saratoga Ave
- 14231 Juniper Ln
- 19437 Via Real Dr
- 14355 Saratoga Ave Unit B
- 14355 Saratoga Ave Unit A
- 14351 Saratoga Ave Unit A
- 19825 Douglass Ln
- 19423 Vineyard Ln
- 13459 Briar Ct
- 20200 Glen Brae Dr
- 20173 Glen Brae Dr
- 13460 Alder Ct
- 20136 Glen Brae Dr
- 20153 Glen Brae Dr
- 13477 Briar Ct
- 20195 Glen Brae Dr
- 13458 Briar Ct
- 13480 Alder Ct
- 20213 Glen Brae Dr
- 20133 Glen Brae Dr
- 13478 Briar Ct
- 20178 Edinburgh Dr
- 20154 Edinburgh Dr
- 13495 Briar Ct
- 20114 Glen Brae Dr
- 20234 Glen Brae Dr
- 13494 Alder Ct
- 13457 Alder Ct