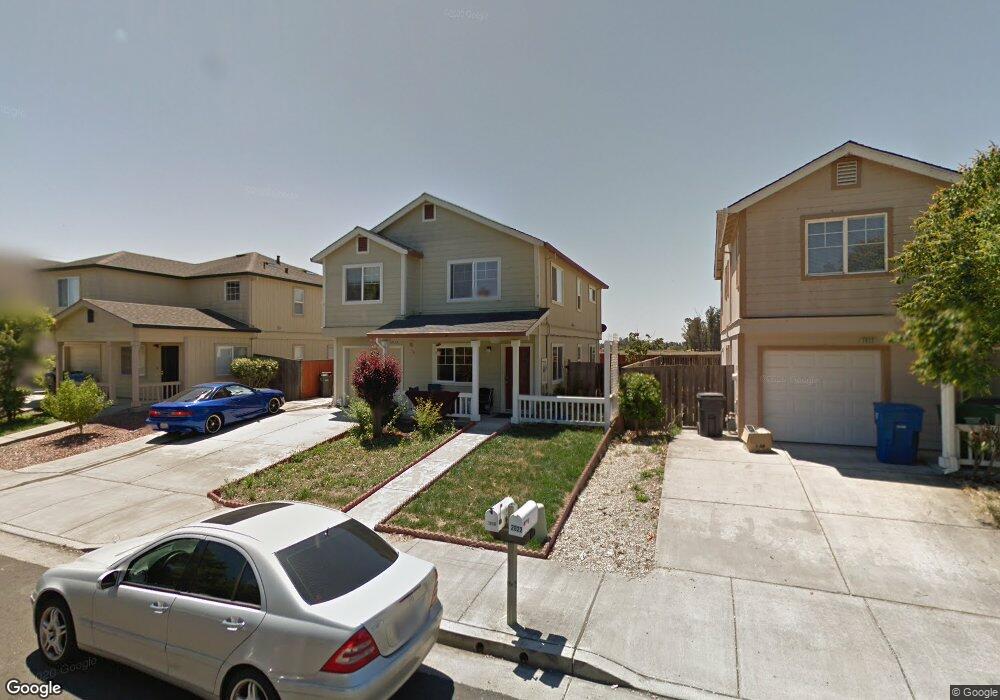
2018 Burgess Dr Santa Rosa, CA 95407
Estimated Value: $601,000 - $693,000
4
Beds
2
Baths
1,532
Sq Ft
$417/Sq Ft
Est. Value
About This Home
This home is located at 2018 Burgess Dr, Santa Rosa, CA 95407 and is currently estimated at $638,388, approximately $416 per square foot. 2018 Burgess Dr is a home located in Sonoma County with nearby schools including Elsie Allen High School and St. Michael's Orthodox School.
Ownership History
Date
Name
Owned For
Owner Type
Purchase Details
Closed on
Nov 30, 2022
Sold by
Guillen Carlos Antonio Rivera
Bought by
Caballo Trust
Current Estimated Value
Purchase Details
Closed on
Dec 10, 2013
Sold by
Mancia Guillen Carlos Antonio Rivera and Mancia Valle Karla J
Bought by
Guillen Carlos Antonio Rivera
Purchase Details
Closed on
Sep 27, 2012
Sold by
Oliva Bruno Flores Otoniel and Oliva Bruno Rosas
Bought by
Mancia Guillen Carlos Antonio Rivera and Mancia Valle Karla J
Home Financials for this Owner
Home Financials are based on the most recent Mortgage that was taken out on this home.
Original Mortgage
$201,286
Interest Rate
3.75%
Mortgage Type
FHA
Purchase Details
Closed on
Nov 2, 2002
Sold by
Burbank Housing Development Corp
Bought by
Oliva Bruno Flores Otoniel and Oliva Bruno Rosas
Home Financials for this Owner
Home Financials are based on the most recent Mortgage that was taken out on this home.
Original Mortgage
$115,236
Interest Rate
5.95%
Create a Home Valuation Report for This Property
The Home Valuation Report is an in-depth analysis detailing your home's value as well as a comparison with similar homes in the area
Home Values in the Area
Average Home Value in this Area
Purchase History
| Date | Buyer | Sale Price | Title Company |
|---|---|---|---|
| Caballo Trust | -- | -- | |
| Guillen Carlos Antonio Rivera | -- | Fidelity National Title Co | |
| Mancia Guillen Carlos Antonio Rivera | $205,000 | First American Title Company | |
| Oliva Bruno Flores Otoniel | $250,000 | North American Title Co |
Source: Public Records
Mortgage History
| Date | Status | Borrower | Loan Amount |
|---|---|---|---|
| Previous Owner | Mancia Guillen Carlos Antonio Rivera | $201,286 | |
| Previous Owner | Oliva Bruno Flores Otoniel | $115,236 |
Source: Public Records
Tax History Compared to Growth
Tax History
| Year | Tax Paid | Tax Assessment Tax Assessment Total Assessment is a certain percentage of the fair market value that is determined by local assessors to be the total taxable value of land and additions on the property. | Land | Improvement |
|---|---|---|---|---|
| 2025 | $3,904 | $337,671 | $136,293 | $201,378 |
| 2024 | $3,904 | $331,051 | $133,621 | $197,430 |
| 2023 | $3,904 | $324,560 | $131,001 | $193,559 |
| 2022 | $3,811 | $318,197 | $128,433 | $189,764 |
| 2021 | $3,771 | $311,959 | $125,915 | $186,044 |
| 2020 | $3,663 | $308,761 | $124,624 | $184,137 |
| 2019 | $3,619 | $302,708 | $122,181 | $180,527 |
| 2018 | $3,590 | $296,774 | $119,786 | $176,988 |
| 2017 | $3,504 | $290,956 | $117,438 | $173,518 |
| 2016 | $3,457 | $285,252 | $115,136 | $170,116 |
| 2015 | $3,348 | $280,968 | $113,407 | $167,561 |
| 2014 | $3,231 | $275,465 | $111,186 | $164,279 |
Source: Public Records
Map
Nearby Homes
- 2599 Silver Spur Dr
- 2632 Wild Bill Way
- 2630 Arrowhead Dr
- 2622 Arrowhead Dr
- 2716 Amora Cir
- Plan 2 at Grove Village
- Plan 4 at Grove Village
- Plan 5 at Grove Village
- Plan 1 at Grove Village
- Plan 6 at Grove Village
- 2863 Liscum St
- 2912 Liscum St
- 2928 Liscum St
- 2931 Liscum St
- 2766 Sassy St
- 2771 Sassy St
- 2778 Sassy St
- 2779 Sassy St
- 2786 Sassy St
- 2790 Sassy St
- 2014 Burgess Dr
- 2022 Burgess Dr
- 2010 Burgess Dr
- 2015 Applejack Way
- 2026 Burgess Dr
- 2011 Applejack Way
- 2019 Applejack Way
- 2006 Burgess Dr
- 2008 Banjo Dr
- 2023 Applejack Way
- 2007 Applejack Way
- 2012 Banjo Dr
- 2004 Banjo Dr
- 2002 Burgess Dr
- 2016 Banjo Dr
- 2000 Banjo Dr
- 2003 Applejack Way
- 2020 Applejack Way
- 2016 Applejack Way
- 2024 Applejack Way