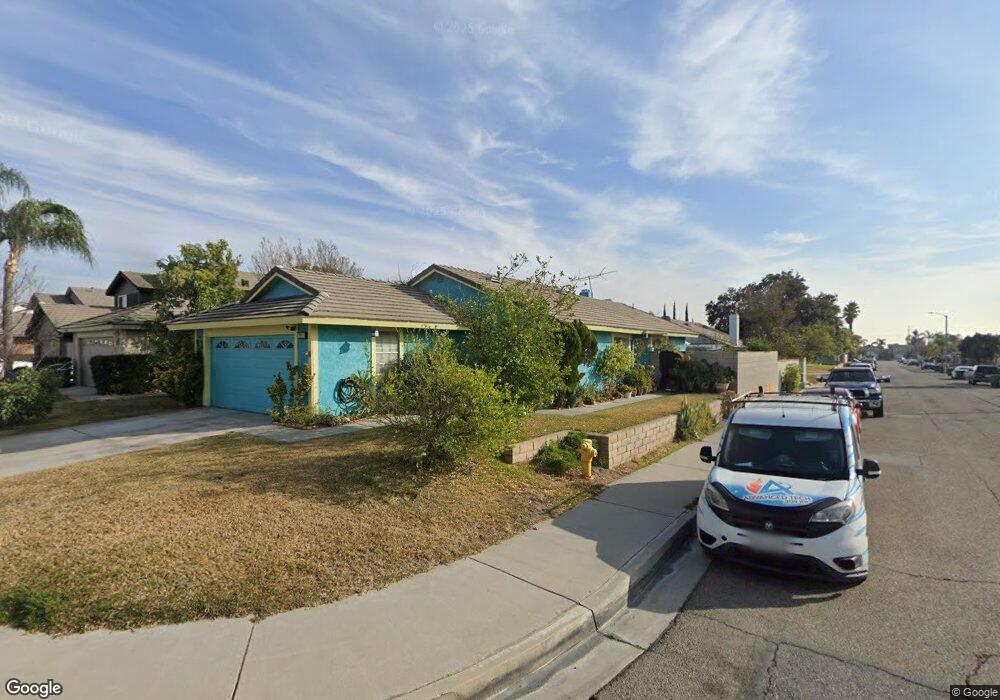
2018 Cluster Pine Rd Colton, CA 92324
Estimated Value: $504,000 - $579,000
3
Beds
2
Baths
1,206
Sq Ft
$440/Sq Ft
Est. Value
About This Home
This home is located at 2018 Cluster Pine Rd, Colton, CA 92324 and is currently estimated at $530,416, approximately $439 per square foot. 2018 Cluster Pine Rd is a home located in San Bernardino County with nearby schools including Georgia Morris Elementary School, William G. Jehue Middle School, and Rialto High School.
Ownership History
Date
Name
Owned For
Owner Type
Purchase Details
Closed on
Dec 11, 2003
Sold by
Mayorga Mario
Bought by
Mayorga Lorenzo J and Mayorga Aracely
Current Estimated Value
Purchase Details
Closed on
Jun 23, 1998
Sold by
Hud
Bought by
Mayorga Lorenzo and Mayorga Aracely
Home Financials for this Owner
Home Financials are based on the most recent Mortgage that was taken out on this home.
Original Mortgage
$83,333
Interest Rate
6.88%
Mortgage Type
FHA
Purchase Details
Closed on
Sep 16, 1997
Sold by
Reliastar Mtg Corp
Bought by
Hud
Purchase Details
Closed on
Apr 17, 1997
Sold by
Juana Diaz Francisco Javier
Bought by
Reliastar Mtg Corp and Washington Square Mtg Company
Create a Home Valuation Report for This Property
The Home Valuation Report is an in-depth analysis detailing your home's value as well as a comparison with similar homes in the area
Home Values in the Area
Average Home Value in this Area
Purchase History
| Date | Buyer | Sale Price | Title Company |
|---|---|---|---|
| Mayorga Lorenzo J | -- | Southland Title | |
| Mayorga Lorenzo | $82,000 | Fidelity National Title | |
| Hud | -- | First Southwestern Title | |
| Reliastar Mtg Corp | $138,009 | First Southwestern Title Co |
Source: Public Records
Mortgage History
| Date | Status | Borrower | Loan Amount |
|---|---|---|---|
| Previous Owner | Mayorga Lorenzo | $83,333 |
Source: Public Records
Tax History
| Year | Tax Paid | Tax Assessment Tax Assessment Total Assessment is a certain percentage of the fair market value that is determined by local assessors to be the total taxable value of land and additions on the property. | Land | Improvement |
|---|---|---|---|---|
| 2025 | $2,119 | $167,971 | $44,736 | $123,235 |
| 2024 | $2,047 | $164,678 | $43,859 | $120,819 |
| 2023 | $2,174 | $161,449 | $42,999 | $118,450 |
| 2022 | $2,025 | $158,283 | $42,156 | $116,127 |
| 2021 | $2,011 | $155,179 | $41,329 | $113,850 |
| 2020 | $2,022 | $153,588 | $40,905 | $112,683 |
| 2019 | $1,977 | $150,577 | $40,103 | $110,474 |
| 2018 | $1,920 | $147,625 | $39,317 | $108,308 |
| 2017 | $1,905 | $144,730 | $38,546 | $106,184 |
| 2016 | $1,883 | $141,892 | $37,790 | $104,102 |
| 2015 | $1,889 | $139,760 | $37,222 | $102,538 |
| 2014 | $1,782 | $137,022 | $36,493 | $100,529 |
Source: Public Records
Map
Nearby Homes
- 1972 De Anza Dr
- 340 Lilly St
- 1065 Martinez Ln
- 993 S Date Ave
- 1025 S Riverside Ave Unit 66
- 825 S Acacia Ave
- 1155 S Riverside Ave Unit 10
- 1155 S Riverside Ave Unit 22
- 1155 S Riverside Ave Unit 7
- 1928 Ray Abril Jr Ln
- 758 S Acacia Ave
- 365 E Vodden St
- 1166 S Riverside Ave Unit 9
- 742 S Magnolia Ave
- 1250 Iron Horse Cir
- 722 S Sycamore Ave
- 827 S Riverside Ave
- 629 S Sage Ave
- 426 E Orchard St
- 125 W Alru St
- 2016 Cluster Pine Rd
- 2012 Cluster Dr
- 2012 Cluster Pine Rd
- 2017 Date Tree Rd
- 2015 Date Tree Rd
- 2010 Cluster Pine Rd
- 1265 Joshua Tree St
- 1257 Joshua Tree St
- 2011 Date Tree Rd
- 1273 Joshua Tree St
- 1243 Joshua Tree St
- 2008 Cluster Pine Rd
- 2009 Date Tree Rd
- 2017 Cluster Pine Rd
- 1229 Joshua Tree St
- 2019 Cluster Pine Rd
- 2023 Cluster Pine Rd
- 2013 Cluster Pine Rd
- 2025 Cluster Pine Rd
- 2011 Cluster Pine Rd
Your Personal Tour Guide
Ask me questions while you tour the home.