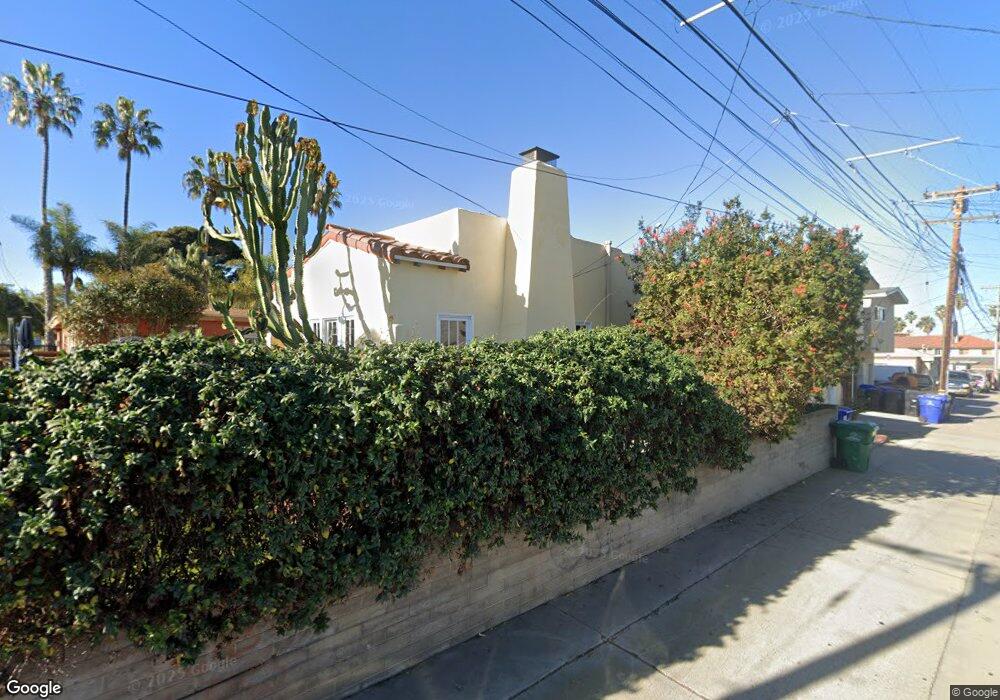
2018 Ebers St San Diego, CA 92107
Ocean Beach NeighborhoodEstimated Value: $1,122,507 - $1,672,000
2
Beds
1
Bath
772
Sq Ft
$1,741/Sq Ft
Est. Value
About This Home
This home is located at 2018 Ebers St, San Diego, CA 92107 and is currently estimated at $1,343,877, approximately $1,740 per square foot. 2018 Ebers St is a home located in San Diego County with nearby schools including Ocean Beach Elementary School, Richard Henry Dana Middle School, and Correia Middle School.
Ownership History
Date
Name
Owned For
Owner Type
Purchase Details
Closed on
Aug 21, 2020
Sold by
Saunders Robert Anthony and Allen Saunders Sherri
Bought by
Saunders Robert Anthony and Allen Saunders Sherri
Current Estimated Value
Home Financials for this Owner
Home Financials are based on the most recent Mortgage that was taken out on this home.
Original Mortgage
$75,000
Outstanding Balance
$53,136
Interest Rate
2.9%
Mortgage Type
Construction
Estimated Equity
$1,290,741
Purchase Details
Closed on
May 7, 1997
Sold by
Bank Of America Nt & Sa
Bought by
Saunders Robert A and Allen Saunders Sherri
Home Financials for this Owner
Home Financials are based on the most recent Mortgage that was taken out on this home.
Original Mortgage
$168,198
Interest Rate
8.13%
Mortgage Type
VA
Create a Home Valuation Report for This Property
The Home Valuation Report is an in-depth analysis detailing your home's value as well as a comparison with similar homes in the area
Home Values in the Area
Average Home Value in this Area
Purchase History
| Date | Buyer | Sale Price | Title Company |
|---|---|---|---|
| Saunders Robert Anthony | -- | Bnt Title Company Of Ca | |
| Saunders Robert A | $165,000 | Old Republic Title Company |
Source: Public Records
Mortgage History
| Date | Status | Borrower | Loan Amount |
|---|---|---|---|
| Open | Saunders Robert Anthony | $75,000 | |
| Closed | Saunders Robert A | $168,198 |
Source: Public Records
Tax History Compared to Growth
Tax History
| Year | Tax Paid | Tax Assessment Tax Assessment Total Assessment is a certain percentage of the fair market value that is determined by local assessors to be the total taxable value of land and additions on the property. | Land | Improvement |
|---|---|---|---|---|
| 2025 | $3,268 | $268,543 | $228,005 | $40,538 |
| 2024 | $3,268 | $263,279 | $223,535 | $39,744 |
| 2023 | $3,196 | $258,117 | $219,152 | $38,965 |
| 2022 | $3,111 | $253,056 | $214,855 | $38,201 |
| 2021 | $3,090 | $248,095 | $210,643 | $37,452 |
| 2020 | $2,967 | $245,552 | $208,484 | $37,068 |
| 2019 | $2,913 | $240,739 | $204,397 | $36,342 |
| 2018 | $2,723 | $236,020 | $200,390 | $35,630 |
| 2017 | $80 | $231,393 | $196,461 | $34,932 |
| 2016 | $2,611 | $226,857 | $192,609 | $34,248 |
| 2015 | $2,572 | $223,450 | $189,716 | $33,734 |
| 2014 | $2,531 | $219,074 | $186,000 | $33,074 |
Source: Public Records
Map
Nearby Homes
- 4685 Long Branch Ave
- 4865 Brighton Ave
- 4620 Narragansett Ave
- 4434 Santa Monica Ave
- 4474 Niagara Ave
- 2226 Etiwanda St
- 4922 Muir Ave
- 4776-78 Del Monte Ave
- 4527 Narragansett Ave
- 4851 Narragansett Ave
- 0 Voltaire St Unit 2600086
- 2222 Bolinas St
- 4377 Newport Ave
- 5035 Saratoga Ave
- 4614 Larkspur St
- 4985 Narragansett Ave Unit 87
- 4225 Whittier St
- 2187 Catalina Blvd
- 4177 Voltaire St
- 4912 Coronado Ave
- 4714 Saratoga Ave Unit 16
- 4710 Saratoga Ave
- 4714-16 Saratoga Ave
- 2030 Ebers St
- 4718 Saratoga Ave
- 4718 Saratoga Ave
- 4722 Saratoga Ave Unit 24
- 4711 Cape May Ave
- 4715 Cape May Ave
- 4719 Cape May Ave
- 4705 Cape May Ave
- 4728 Saratoga Ave
- 2015 Ebers St
- 2011 Ebers St
- 2005 Ebers St
- 4721 Cape May Ave
- 2003 Ebers St
- 2037 Ebers St
- 4727 Cape May Ave
- 4729 Cape May Ave Unit 31