S
Seller's Agent in 2016
Sandra Jariwala
Opendoor Brokerage, LLC

Estimated Value: $344,954 - $395,000
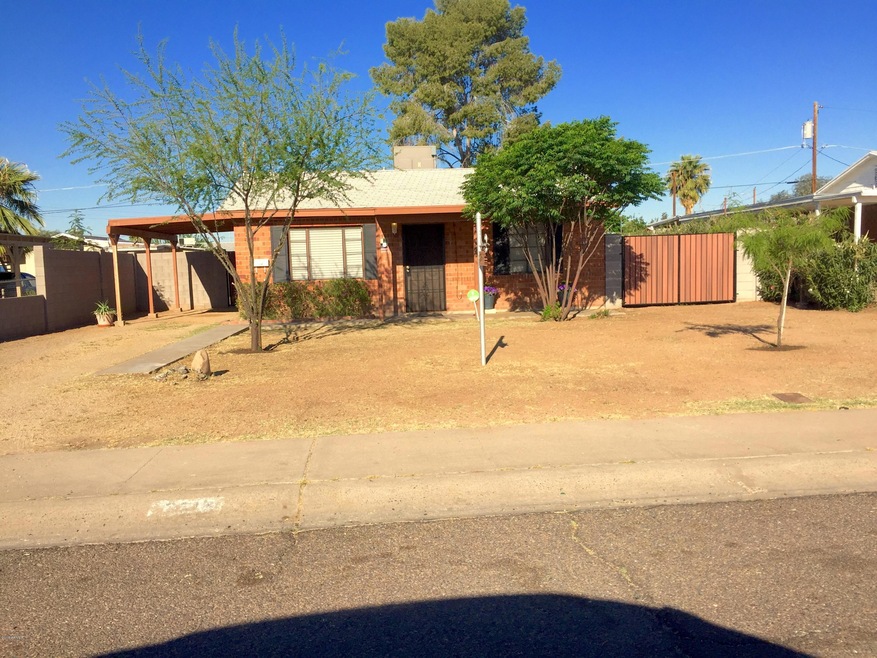
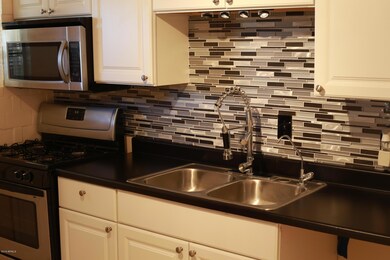
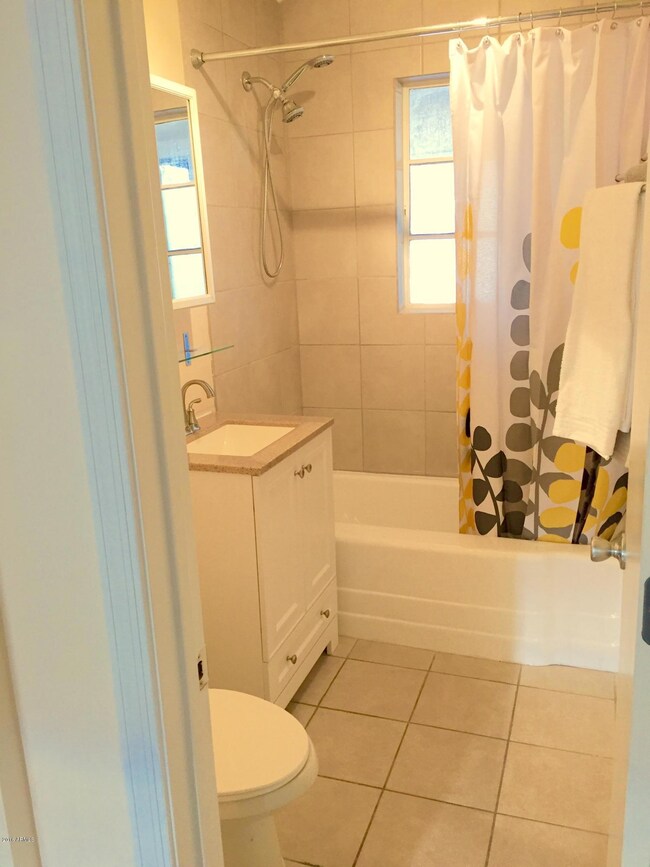
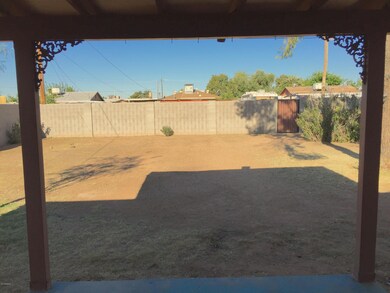
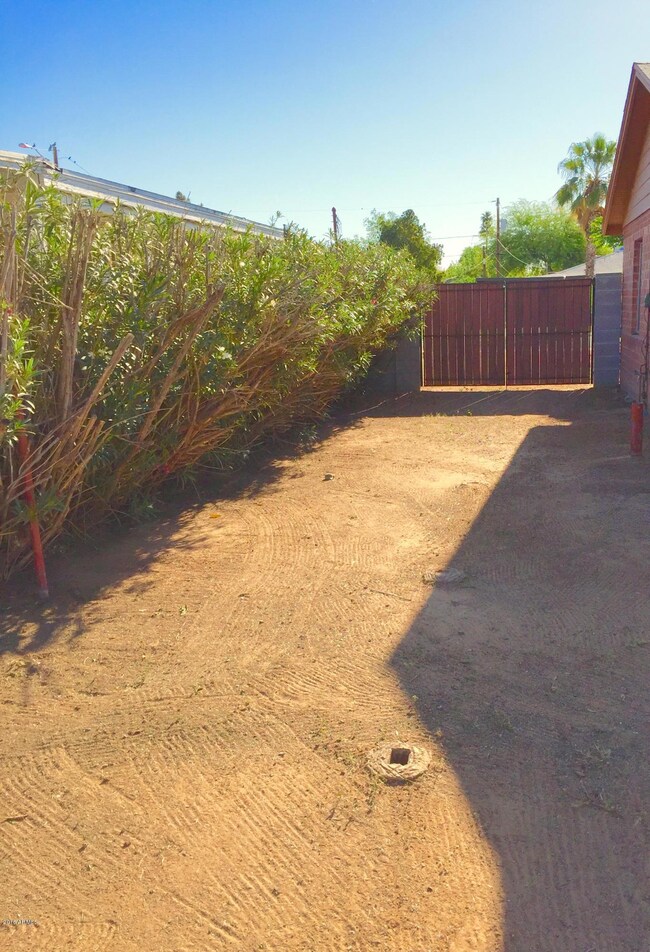
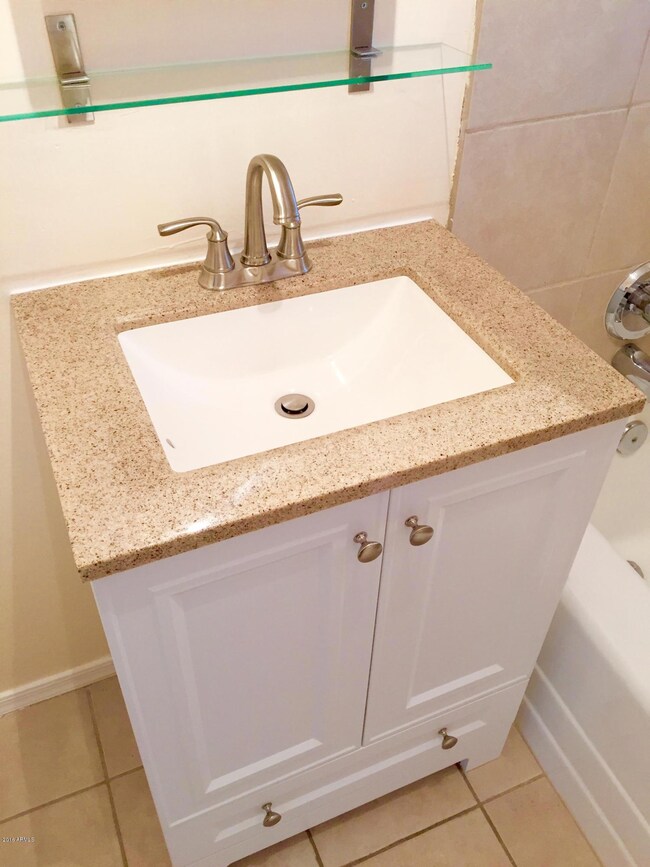
COME SEE THIS CHARMING RED BRICK HOME LOCATED IN EAST CENTRAL PHOENIX WHERE YOU ARE CLOSE TO VIRTUALLY EVERYTHING! HOME HAS RECENTLY GOTTEN A MAKEOVER AND IT’S DEFINITELY A CROWD PLEASER. LARGE ENCLOSED ARIZONA ROOM / BONUS ROOM OVERLOOKS COVERED PATIO AND ENORMOUS BACKYARD, PERFECT FOR ENTERTAINING OR BUILDING A CASITA FOR PARENTS, COMPLETE WITH A RV GATE. MAKE THIS YOUR HOME TODAY! ALARM ACTIVATED. PROPERTY SOLD AS-IS.
Last Agent to Sell the Property
Sandra Jariwala
Opendoor Brokerage, LLC License #SA645751000 Listed on: 03/31/2016
| Date | Buyer | Sale Price | Title Company |
|---|---|---|---|
| Hardy Andrea Elizabeth | $159,899 | Old Republic Title Agency | |
| Melero Sandra U | $55,000 | Great American Title Agency | |
| Lineage Homes Llc | $20,000 | Chicago Title | |
| Encinas Building Group Llc | $16,500 | Chicago Title | |
| Milmont James G | -- | -- |
| Date | Status | Borrower | Loan Amount |
|---|---|---|---|
| Open | Hardy Andrea Elizabeth | $157,002 | |
| Previous Owner | Melero Sandra U | $53,605 |
| Date | Event | Price | List to Sale | Price per Sq Ft |
|---|---|---|---|---|
| 10/23/2023 10/23/23 | Off Market | $159,899 | -- | -- |
| 05/26/2016 05/26/16 | Sold | $159,899 | 0.0% | $165 / Sq Ft |
| 04/07/2016 04/07/16 | Pending | -- | -- | -- |
| 03/31/2016 03/31/16 | For Sale | $159,899 | -- | $165 / Sq Ft |
| Year | Tax Paid | Tax Assessment Tax Assessment Total Assessment is a certain percentage of the fair market value that is determined by local assessors to be the total taxable value of land and additions on the property. | Land | Improvement |
|---|---|---|---|---|
| 2025 | $1,225 | $10,252 | -- | -- |
| 2024 | $1,164 | $9,764 | -- | -- |
| 2023 | $1,164 | $23,800 | $4,760 | $19,040 |
| 2022 | $1,114 | $17,980 | $3,590 | $14,390 |
| 2021 | $1,156 | $17,220 | $3,440 | $13,780 |
| 2020 | $1,126 | $14,500 | $2,900 | $11,600 |
| 2019 | $1,119 | $13,100 | $2,620 | $10,480 |
| 2018 | $1,095 | $11,710 | $2,340 | $9,370 |
| 2017 | $1,050 | $9,130 | $1,820 | $7,310 |
| 2016 | $410 | $6,760 | $1,350 | $5,410 |
| 2015 | $382 | $4,780 | $950 | $3,830 |
S
Seller's Agent in 2016
Sandra Jariwala
Opendoor Brokerage, LLC

Buyer's Agent in 2016
Daniel Brown
My Home Group
(480) 707-2934
16 in this area
374 Total Sales
Source: Arizona Regional Multiple Listing Service (ARMLS)
MLS Number: 5421012
APN: 120-26-060
Disclaimer: Certain information contained herein is derived from information provided by parties other than Homes.com. All information provided is deemed reliable, but is not guaranteed to be accurate and should be independently verified.
![]() All information should be verified by the recipient and none is guaranteed as accurate by ARMLS
All information should be verified by the recipient and none is guaranteed as accurate by ARMLS
Listing Information presented by local MLS brokerage: Ten-X, local REALTOR®- Arlene Richardson - (888)-952-6393