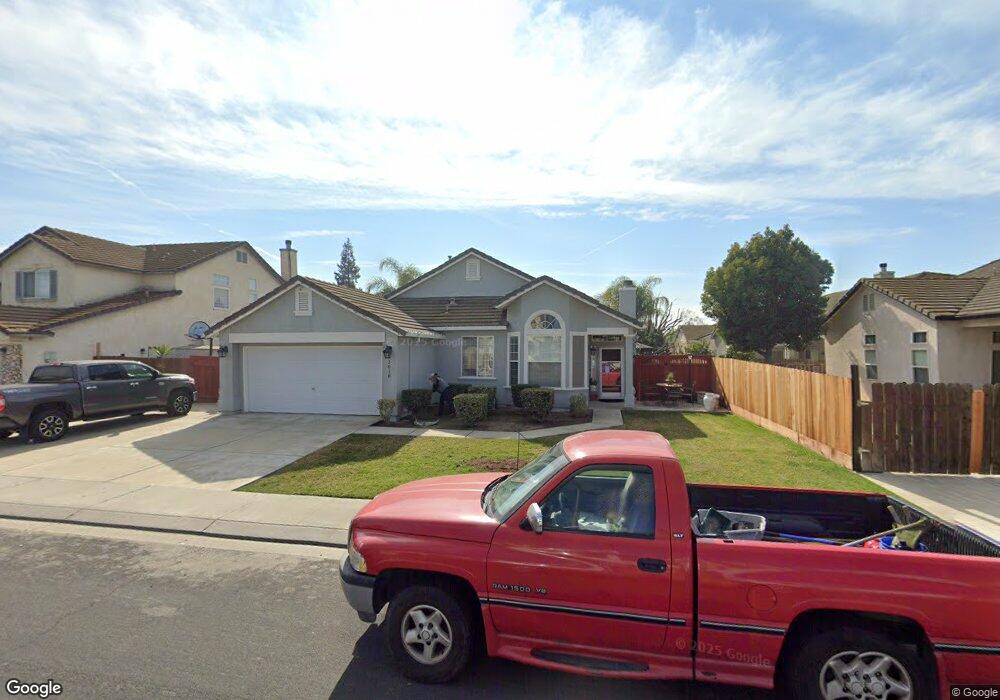
2018 Nushake Way Manteca, CA 95336
Estimated Value: $591,094 - $617,000
4
Beds
2
Baths
1,866
Sq Ft
$322/Sq Ft
Est. Value
About This Home
This home is located at 2018 Nushake Way, Manteca, CA 95336 and is currently estimated at $601,274, approximately $322 per square foot. 2018 Nushake Way is a home located in San Joaquin County with nearby schools including George McParland Elementary School, East Union High School, and BE.TECH Charter High School.
Ownership History
Date
Name
Owned For
Owner Type
Purchase Details
Closed on
Jun 12, 2019
Sold by
Murillo Jose Lionel and Murillo Lionel
Bought by
Murillo Jose Lionel and Murillo Maria
Current Estimated Value
Home Financials for this Owner
Home Financials are based on the most recent Mortgage that was taken out on this home.
Original Mortgage
$330,000
Outstanding Balance
$290,151
Interest Rate
4.1%
Mortgage Type
New Conventional
Estimated Equity
$311,123
Purchase Details
Closed on
Jul 16, 2004
Sold by
Murillo Maria Colondres
Bought by
Murillo Lionel
Home Financials for this Owner
Home Financials are based on the most recent Mortgage that was taken out on this home.
Original Mortgage
$260,000
Interest Rate
6.27%
Mortgage Type
New Conventional
Purchase Details
Closed on
Jan 7, 2000
Sold by
Raymus Properties Inc
Bought by
Murillo Lionel and Murillo Maria Colondres
Home Financials for this Owner
Home Financials are based on the most recent Mortgage that was taken out on this home.
Original Mortgage
$182,682
Interest Rate
7.83%
Mortgage Type
FHA
Create a Home Valuation Report for This Property
The Home Valuation Report is an in-depth analysis detailing your home's value as well as a comparison with similar homes in the area
Purchase History
| Date | Buyer | Sale Price | Title Company |
|---|---|---|---|
| Murillo Jose Lionel | -- | Fidelity National Ttl Group | |
| Murillo Lionel | -- | Fidelity Natl Title Ins Co | |
| Murillo Lionel | $184,000 | First American Title Co |
Source: Public Records
Mortgage History
| Date | Status | Borrower | Loan Amount |
|---|---|---|---|
| Open | Murillo Jose Lionel | $330,000 | |
| Closed | Murillo Lionel | $260,000 | |
| Closed | Murillo Lionel | $182,682 |
Source: Public Records
Tax History
| Year | Tax Paid | Tax Assessment Tax Assessment Total Assessment is a certain percentage of the fair market value that is determined by local assessors to be the total taxable value of land and additions on the property. | Land | Improvement |
|---|---|---|---|---|
| 2025 | $4,045 | $310,516 | $76,842 | $233,674 |
| 2024 | $3,948 | $304,429 | $75,336 | $229,093 |
| 2023 | $3,897 | $298,460 | $73,859 | $224,601 |
| 2022 | $3,852 | $292,609 | $72,411 | $220,198 |
| 2021 | $3,816 | $286,873 | $70,992 | $215,881 |
| 2020 | $3,686 | $283,933 | $70,265 | $213,668 |
| 2019 | $3,641 | $278,367 | $68,888 | $209,479 |
| 2018 | $3,596 | $272,910 | $67,538 | $205,372 |
| 2017 | $3,549 | $267,560 | $66,214 | $201,346 |
| 2016 | $3,485 | $262,315 | $64,916 | $197,399 |
| 2014 | $3,265 | $253,314 | $62,688 | $190,626 |
Source: Public Records
Map
Nearby Homes
- 2594 Arabetto Ln
- 2646 Arabetto Ln
- 2641 Arabetto Ln
- 2638 Arabetto Ln
- 1683 Portabella Place
- 1847 Bergthold St
- 1823 Piedmont Dr
- 1588 Hastings Dr
- 1366 Garibaldi Place
- 1739 Glenoaks St
- 1552 Liverpool Ct
- 2141 Knollwood Ct
- 2159 Knollwood Ct
- 2439 Appleleaf Ln
- 2443 Plumcreek Ln
- 2349 Belle Glade Ln
- 2473 Dutchwood Ln
- 2491 Redbud Way
- 1494 Hilary Way
- 1709 Fox Trot Way
- 2004 Nushake Way
- 1874 Scharmann Ln
- 1850 Scharmann Ln
- 2019 Hastings Dr
- 2003 Hastings Dr
- 1992 Nushake Way
- 1826 Scharmann Ln
- 2015 Nushake Way
- 2029 Nushake Way
- 1997 Hastings Dr
- 2003 Nushake Way
- 2043 Nushake Way
- 1984 Nushake Way
- 1991 Nushake Way
- 1983 Hastings Dr
- 1873 Scharmann Ln
- 2028 Passages St
- 1983 Nushake Way
- 1976 Nushake Way
- 1851 Scharmann Ln
Your Personal Tour Guide
Ask me questions while you tour the home.