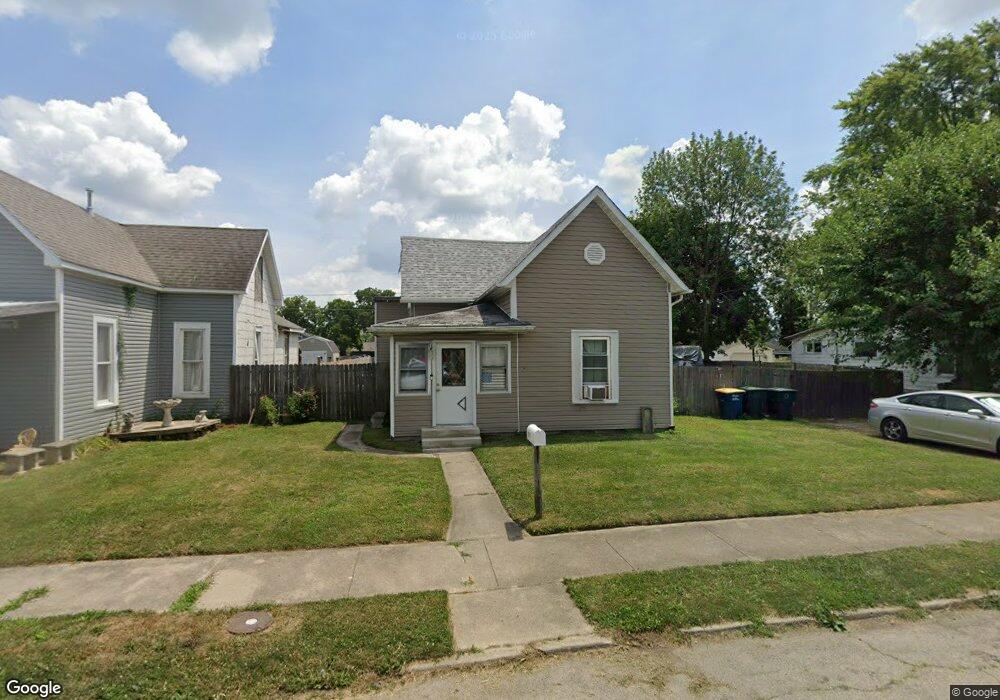
2018 S Jefferson St Muncie, IN 47302
Southside NeighborhoodEstimated Value: $66,224 - $91,000
2
Beds
1
Bath
1,234
Sq Ft
$62/Sq Ft
Est. Value
About This Home
This home is located at 2018 S Jefferson St, Muncie, IN 47302 and is currently estimated at $76,306, approximately $61 per square foot. 2018 S Jefferson St is a home located in Delaware County with nearby schools including South View Elementary School, Muncie Central High School, and Southside Middle School.
Ownership History
Date
Name
Owned For
Owner Type
Purchase Details
Closed on
Aug 14, 2023
Sold by
Llamas Maria
Bought by
Gonzalez Victor M
Current Estimated Value
Purchase Details
Closed on
Jul 9, 2021
Sold by
Fowler David and Fowler Karen
Bought by
Llamas Maria
Purchase Details
Closed on
Aug 25, 2016
Sold by
M Jewell Llc
Bought by
Fowler David and Fowler Karen
Purchase Details
Closed on
Sep 6, 2007
Sold by
Dulplasr Joshua Ray
Bought by
Dulplasr Steven R
Purchase Details
Closed on
Sep 15, 2006
Sold by
Federal National Mortgage Association
Bought by
Dugger Josh
Purchase Details
Closed on
May 24, 2006
Sold by
Schunck Nancy L
Bought by
Federal National Mortgage Association
Create a Home Valuation Report for This Property
The Home Valuation Report is an in-depth analysis detailing your home's value as well as a comparison with similar homes in the area
Home Values in the Area
Average Home Value in this Area
Purchase History
| Date | Buyer | Sale Price | Title Company |
|---|---|---|---|
| Gonzalez Victor M | -- | None Listed On Document | |
| Llamas Maria | -- | None Available | |
| Fowler David | -- | -- | |
| Dulplasr Steven R | -- | None Available | |
| Dugger Josh | -- | Anchor Title Services Inc | |
| Federal National Mortgage Association | $65,513 | None Available |
Source: Public Records
Tax History Compared to Growth
Tax History
| Year | Tax Paid | Tax Assessment Tax Assessment Total Assessment is a certain percentage of the fair market value that is determined by local assessors to be the total taxable value of land and additions on the property. | Land | Improvement |
|---|---|---|---|---|
| 2024 | $108 | $41,600 | $7,800 | $33,800 |
| 2023 | $108 | $34,700 | $6,500 | $28,200 |
| 2022 | $808 | $35,000 | $6,500 | $28,500 |
| 2021 | $822 | $35,700 | $7,400 | $28,300 |
| 2020 | $718 | $30,500 | $9,900 | $20,600 |
| 2019 | $718 | $30,500 | $9,900 | $20,600 |
| 2018 | $780 | $33,100 | $10,900 | $22,200 |
| 2017 | $784 | $33,800 | $12,000 | $21,800 |
| 2016 | $784 | $33,800 | $12,000 | $21,800 |
| 2014 | $646 | $42,200 | $13,400 | $28,800 |
| 2013 | -- | $41,900 | $13,400 | $28,500 |
Source: Public Records
Map
Nearby Homes
- 2000 S Walnut St
- 1911 S Walnut St
- 2316 S Walnut St
- 1715 S Madison St
- 1702 S High St
- 313 W 10th St
- 218 E 8th St
- 208 E 8th St
- 1921 S Hackley St
- 514 W Memorial Dr
- 2115 S Ebright St
- 617 W 15th St
- 221 E 6th St
- 605 W 10th St
- 2112 S Beacon St
- 1206 S Madison St
- 1303 S Liberty St
- 802 W 13th St
- 429 W 6th St
- 2413 S Gharkey St
- 2008 S Jefferson St
- 2024 S Jefferson St
- 2006 S Jefferson St
- 306 E 14th St
- 2017 S Elm St
- 2000 S Jefferson St
- 2019 S Elm St
- 2007 S Elm St
- 2023 S Elm St
- 2019 S Jefferson St
- 2021 S Jefferson St
- 2009 S Elm St
- 2009 S Elm St Unit 2009 S Elm-Muncie, I
- 2009 S Elm St
- 2005 S Jefferson St
- 2023 S Jefferson St
- 2001 S Elm St
- 2025 S Elm St
- 2003 S Jefferson St
- 2025 S Jefferson St