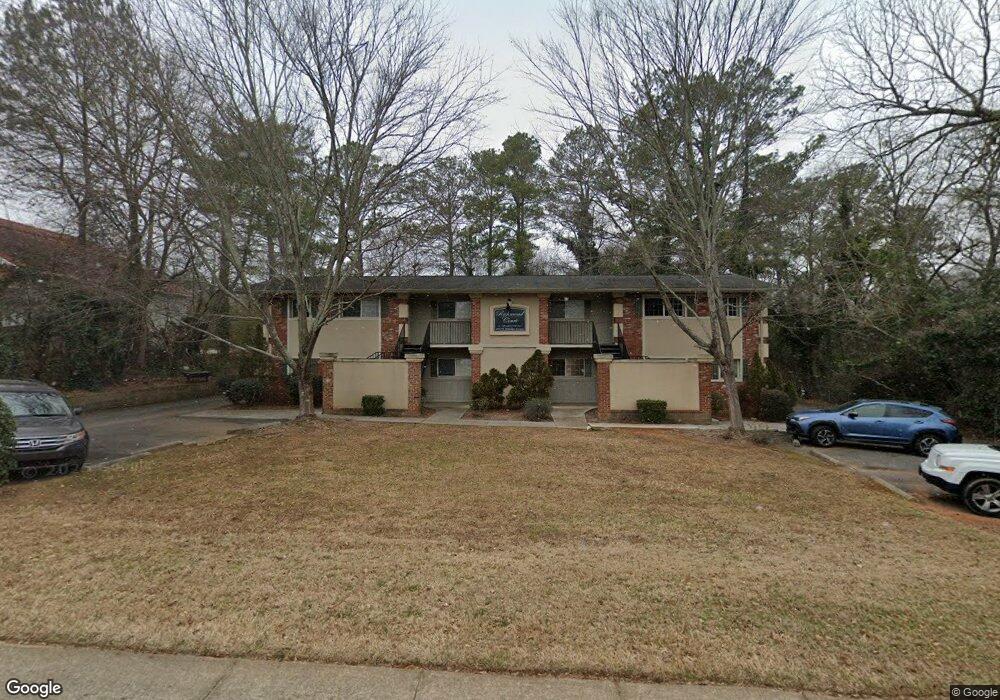
2018 S Milledge Ave Athens, GA 30605
Five Points NeighborhoodEstimated Value: $206,000 - $214,000
--
Bed
1
Bath
682
Sq Ft
$310/Sq Ft
Est. Value
About This Home
This home is located at 2018 S Milledge Ave, Athens, GA 30605 and is currently estimated at $211,154, approximately $309 per square foot. 2018 S Milledge Ave is a home located in Clarke County with nearby schools including Barrow Elementary School, Clarke Middle School, and Clarke Central High School.
Ownership History
Date
Name
Owned For
Owner Type
Purchase Details
Closed on
Feb 14, 2025
Sold by
Vermillion Stephen
Bought by
Simmons Stephen E
Current Estimated Value
Home Financials for this Owner
Home Financials are based on the most recent Mortgage that was taken out on this home.
Original Mortgage
$108,000
Outstanding Balance
$107,646
Interest Rate
7.04%
Mortgage Type
New Conventional
Estimated Equity
$100,349
Purchase Details
Closed on
Nov 13, 2023
Sold by
Legacy Land Lease Llc
Bought by
Vermillion Stephen and Holmes Melisa
Purchase Details
Closed on
Aug 26, 2021
Sold by
Davis Robert D
Bought by
Legacy Land Lease Llc
Home Financials for this Owner
Home Financials are based on the most recent Mortgage that was taken out on this home.
Original Mortgage
$112,000
Interest Rate
2.8%
Mortgage Type
Commercial
Purchase Details
Closed on
May 31, 2006
Sold by
Not Provided
Bought by
Davis Robert D
Home Financials for this Owner
Home Financials are based on the most recent Mortgage that was taken out on this home.
Original Mortgage
$97,194
Interest Rate
6.51%
Mortgage Type
New Conventional
Create a Home Valuation Report for This Property
The Home Valuation Report is an in-depth analysis detailing your home's value as well as a comparison with similar homes in the area
Home Values in the Area
Average Home Value in this Area
Purchase History
| Date | Buyer | Sale Price | Title Company |
|---|---|---|---|
| Simmons Stephen E | $206,000 | -- | |
| Vermillion Stephen | $204,000 | -- | |
| Legacy Land Lease Llc | $140,000 | -- | |
| Davis Robert D | $95,000 | -- |
Source: Public Records
Mortgage History
| Date | Status | Borrower | Loan Amount |
|---|---|---|---|
| Open | Simmons Stephen E | $108,000 | |
| Previous Owner | Legacy Land Lease Llc | $110,086 | |
| Previous Owner | Legacy Land Lease Llc | $112,000 | |
| Previous Owner | Davis Robert D | $154,000 | |
| Previous Owner | Davis Robert D | $97,194 |
Source: Public Records
Tax History Compared to Growth
Tax History
| Year | Tax Paid | Tax Assessment Tax Assessment Total Assessment is a certain percentage of the fair market value that is determined by local assessors to be the total taxable value of land and additions on the property. | Land | Improvement |
|---|---|---|---|---|
| 2024 | $2,550 | $81,590 | $8,000 | $73,590 |
| 2023 | $2,550 | $68,344 | $8,000 | $60,344 |
| 2022 | $1,785 | $55,961 | $8,000 | $47,961 |
| 2021 | $1,296 | $38,447 | $8,000 | $30,447 |
| 2020 | $1,262 | $37,186 | $8,000 | $29,186 |
| 2019 | $1,255 | $36,972 | $8,000 | $28,972 |
| 2018 | $1,224 | $36,057 | $8,000 | $28,057 |
| 2017 | $0 | $33,552 | $8,000 | $25,552 |
| 2016 | $1,073 | $31,593 | $8,000 | $23,593 |
| 2015 | $1,076 | $31,644 | $8,000 | $23,644 |
| 2014 | $1,078 | $31,645 | $8,000 | $23,645 |
Source: Public Records
Map
Nearby Homes
- 1775 S Milledge Ave
- 128 Habersham Dr
- 115 Annes Ct
- 655 E Campus Rd Unit 12
- 123 Garden Ln
- 204 Gran Ellen Dr
- 194 Weymanda Cir
- 2165 S Milledge Ave Unit F4
- 175 Pinecrest Ct
- 1697 S Milledge Ave
- 685 Pinecrest Dr
- 145 Heatherwood Ln
- 160 Riverdale Dr
- 301 Parkway Dr
- 595 Macon Hwy Unit 9
- 143 Eaglewood Way Unit 17
- 490 Ofarrell St
- 2018 S Milledge Ave Unit 8
- 2018 S Milledge Ave Unit 2
- 2018 S Milledge Ave Unit 4
- 2018 S Milledge Ave Unit 6
- 2018 S Milledge Ave Unit 7
- 2018 S Milledge Ave Unit 3
- 2018 S Milledge Ave Unit 6
- 2018 S Milledge Ave Unit 3
- 2018 S Milledge Ave
- 2018 S Milledge Ave
- 2018 S Milledge Ave
- 2018 S Milledge Ave
- 2018 S Milledge Ave
- 2018 S Milledge Ave
- 2018 S Milledge Ave
- 2018 S Milledge Ave Unit 1
- 2018 S Milledge Ave Unit 1
- 2024 S Milledge Ave
- 500 Woodland Hills Dr
- 506 Woodland Hills Dr