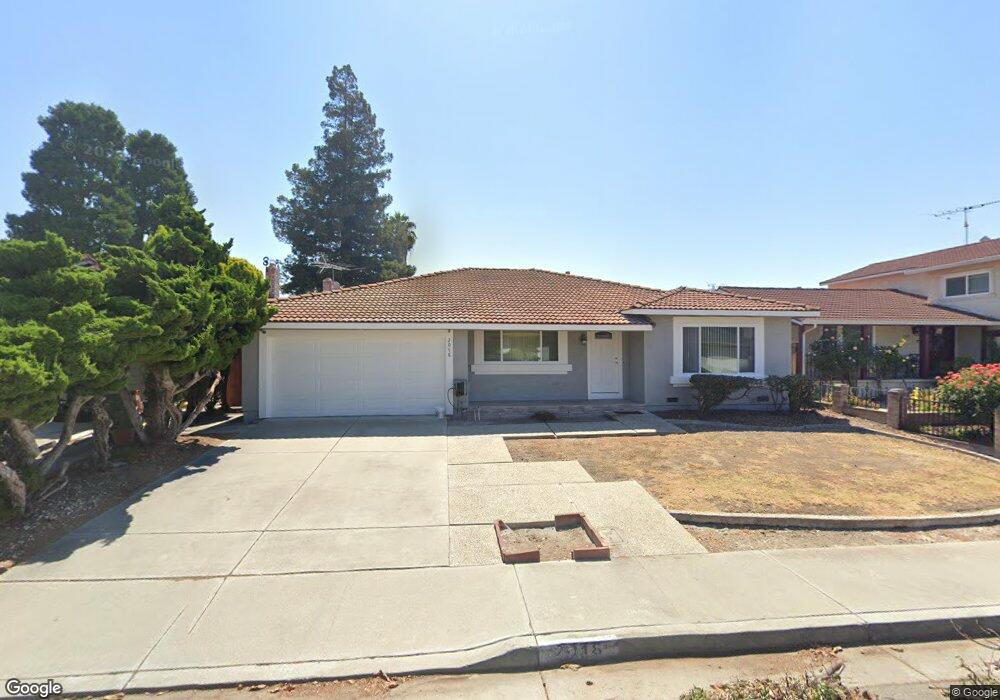
2018 Shellback Place San Jose, CA 95133
Commodore NeighborhoodEstimated Value: $1,572,942 - $1,749,000
4
Beds
3
Baths
2,084
Sq Ft
$791/Sq Ft
Est. Value
About This Home
This home is located at 2018 Shellback Place, San Jose, CA 95133 and is currently estimated at $1,648,236, approximately $790 per square foot. 2018 Shellback Place is a home located in Santa Clara County with nearby schools including Vinci Park Elementary School, Piedmont Middle School, and Independence High School.
Ownership History
Date
Name
Owned For
Owner Type
Purchase Details
Closed on
Jul 15, 2004
Sold by
Vanvanpham Huu Van and Pham Hau Thi Nguyen
Bought by
Tran Hung Thanh
Current Estimated Value
Home Financials for this Owner
Home Financials are based on the most recent Mortgage that was taken out on this home.
Original Mortgage
$440,000
Outstanding Balance
$207,484
Interest Rate
5.37%
Mortgage Type
Purchase Money Mortgage
Estimated Equity
$1,440,752
Create a Home Valuation Report for This Property
The Home Valuation Report is an in-depth analysis detailing your home's value as well as a comparison with similar homes in the area
Home Values in the Area
Average Home Value in this Area
Purchase History
| Date | Buyer | Sale Price | Title Company |
|---|---|---|---|
| Tran Hung Thanh | $607,500 | Fidelity National Title Ins |
Source: Public Records
Mortgage History
| Date | Status | Borrower | Loan Amount |
|---|---|---|---|
| Open | Tran Hung Thanh | $440,000 |
Source: Public Records
Tax History
| Year | Tax Paid | Tax Assessment Tax Assessment Total Assessment is a certain percentage of the fair market value that is determined by local assessors to be the total taxable value of land and additions on the property. | Land | Improvement |
|---|---|---|---|---|
| 2025 | $11,909 | $846,436 | $338,573 | $507,863 |
| 2024 | $11,909 | $829,840 | $331,935 | $497,905 |
| 2023 | $11,700 | $813,570 | $325,427 | $488,143 |
| 2022 | $11,654 | $797,619 | $319,047 | $478,572 |
| 2021 | $11,283 | $781,981 | $312,792 | $469,189 |
| 2020 | $10,941 | $773,964 | $309,585 | $464,379 |
| 2019 | $10,525 | $758,789 | $303,515 | $455,274 |
| 2018 | $10,378 | $743,912 | $297,564 | $446,348 |
| 2017 | $10,443 | $729,327 | $291,730 | $437,597 |
| 2016 | $10,010 | $715,027 | $286,010 | $429,017 |
| 2015 | $9,895 | $704,287 | $281,714 | $422,573 |
| 2014 | $9,140 | $690,492 | $276,196 | $414,296 |
Source: Public Records
Map
Nearby Homes
- 2043 Shellback Place
- 2083 Bluejacket Way
- 1116 Oakbluff Ct
- 1135 Pandolfi Place
- 1136 Ribisi Cir
- 1034 Ribisi Cir
- 2381 Lava Dr
- 2194 Celeste Ct
- 12280 Mabury Rd
- 783 Opie Ct
- 2505 Dillion Ct Unit 3
- 879 Wyman Way Unit 2
- 1682 Commodore Dr
- 1729 Maysong Ct
- 1062 Rymar Place
- 1055 N Capitol Ave Unit 167
- 1055 N Capitol Ave Unit 180
- 1131 Chen St
- 1967 Nevets Ln
- 2465 Sequester Ct
- 2028 Shellback Place
- 2012 Shellback Place
- 2023 Commodore Dr
- 2015 Commodore Dr
- 2031 Commodore Dr
- 2034 Shellback Place
- 2004 Shellback Place
- 2019 Shellback Place
- 2007 Commodore Dr
- 2011 Shellback Place
- 2027 Shellback Place
- 2039 Commodore Dr
- 2003 Shellback Place
- 2035 Shellback Place
- 2036 Shellback Place
- 2047 Commodore Dr
- 2044 Shellback Place
- 2051 Shellback Place
- 2012 Bluejacket Way
- 2020 Bluejacket Way
Your Personal Tour Guide
Ask me questions while you tour the home.