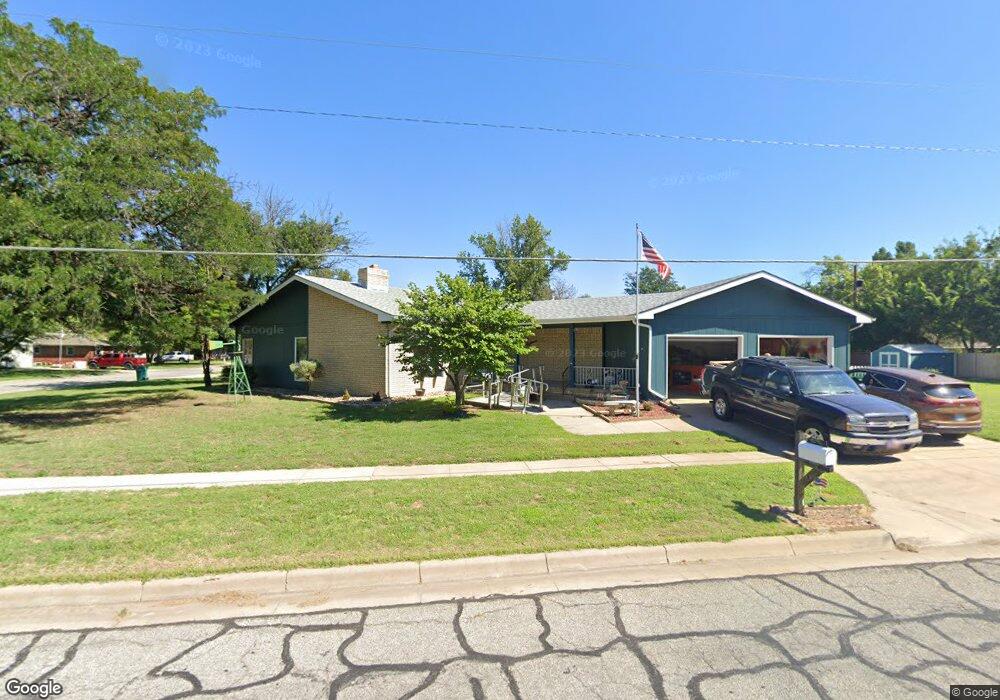
2018 W 31st St N Wichita, KS 67204
Benjamin Hills-Pleasant Valley NeighborhoodEstimated Value: $229,407 - $236,000
2
Beds
2
Baths
1,620
Sq Ft
$144/Sq Ft
Est. Value
About This Home
This home is located at 2018 W 31st St N, Wichita, KS 67204 and is currently estimated at $232,704, approximately $143 per square foot. 2018 W 31st St N is a home located in Sedgwick County with nearby schools including Pleasant Valley Elementary School, Pleasant Valley Middle School, and Wichita North High School.
Ownership History
Date
Name
Owned For
Owner Type
Purchase Details
Closed on
Mar 26, 2021
Sold by
Simon William A and Nichols Bonnie L
Bought by
Simon William A and Simon Bonnie L
Current Estimated Value
Home Financials for this Owner
Home Financials are based on the most recent Mortgage that was taken out on this home.
Original Mortgage
$50,000
Outstanding Balance
$19,279
Interest Rate
3%
Mortgage Type
New Conventional
Estimated Equity
$213,425
Purchase Details
Closed on
May 17, 2018
Sold by
Nicholas Bonnie L
Bought by
Nicholas Bonnie L and Simon William A
Home Financials for this Owner
Home Financials are based on the most recent Mortgage that was taken out on this home.
Original Mortgage
$49,900
Interest Rate
4.4%
Mortgage Type
New Conventional
Purchase Details
Closed on
Apr 16, 2010
Sold by
Schlegel Damita Jo
Bought by
Nichols Bonnie L
Purchase Details
Closed on
May 9, 2001
Sold by
Intrust Bank Na
Bought by
Rogers Troy R and Rogers Dorean
Create a Home Valuation Report for This Property
The Home Valuation Report is an in-depth analysis detailing your home's value as well as a comparison with similar homes in the area
Home Values in the Area
Average Home Value in this Area
Purchase History
| Date | Buyer | Sale Price | Title Company |
|---|---|---|---|
| Simon William A | -- | None Available | |
| Nicholas Bonnie L | -- | None Available | |
| Nichols Bonnie L | -- | Security 1St Title | |
| Rogers Troy R | $95,000 | -- |
Source: Public Records
Mortgage History
| Date | Status | Borrower | Loan Amount |
|---|---|---|---|
| Open | Simon William A | $50,000 | |
| Closed | Nicholas Bonnie L | $49,900 |
Source: Public Records
Tax History Compared to Growth
Tax History
| Year | Tax Paid | Tax Assessment Tax Assessment Total Assessment is a certain percentage of the fair market value that is determined by local assessors to be the total taxable value of land and additions on the property. | Land | Improvement |
|---|---|---|---|---|
| 2025 | $2,430 | $24,518 | $4,784 | $19,734 |
| 2023 | $2,430 | $20,275 | $3,634 | $16,641 |
| 2022 | $2,313 | $18,952 | $3,427 | $15,525 |
| 2021 | $2,215 | $17,549 | $1,863 | $15,686 |
| 2020 | $2,088 | $16,399 | $1,863 | $14,536 |
| 2019 | $1,933 | $15,042 | $1,472 | $13,570 |
| 2018 | $1,723 | $15,042 | $1,472 | $13,570 |
| 2017 | $1,597 | $0 | $0 | $0 |
| 2016 | $1,570 | $0 | $0 | $0 |
| 2015 | -- | $0 | $0 | $0 |
| 2014 | -- | $0 | $0 | $0 |
Source: Public Records
Map
Nearby Homes
- 1626 W 31st St N
- 1722 W 29th St N
- 3354 N Coolidge Ave
- 2024 W 27th St N
- 2960 N Wedgewood Dr
- 2639 N Clarence Ave
- 3249 N Hood Ct
- 3020 N Somerset Dr
- 2629 N Clarence Ave
- 2936 N Wedgewood Dr
- 0000 W 37th St N
- 2826 N Wedgewood Dr
- 2842 N Wedgewood Dr
- 3870 N Friar Ln
- 3316 N Jeanette St
- 2463 N Coolidge Ave
- 1523 W Nottingham Ln
- 000 00
- 3102 Mascot N
- 2425 N Litchfield Ave
- 3212 N Clarence Cir
- 2002 W 31st St N
- 2027 W 31st St N
- 2015 W 31st St N
- 2302 W 31st St N
- 3222 N Clarence Cir
- 3207 N Clarence Cir
- 2011 W 31st St N
- 2035 W 31st St N
- 3223 N Clarence Cir
- 3230 N Clarence Cir
- 2101 W 31st St N
- 3169 N Charles Ave
- 3167 N Charles Ave
- 3253 N Charles Ave
- 3238 N Clarence Cir
- 3200 N Carlock St
- 3220 N Carlock St
- 3239 N Clarence Cir
- 3161 N Charles Ave